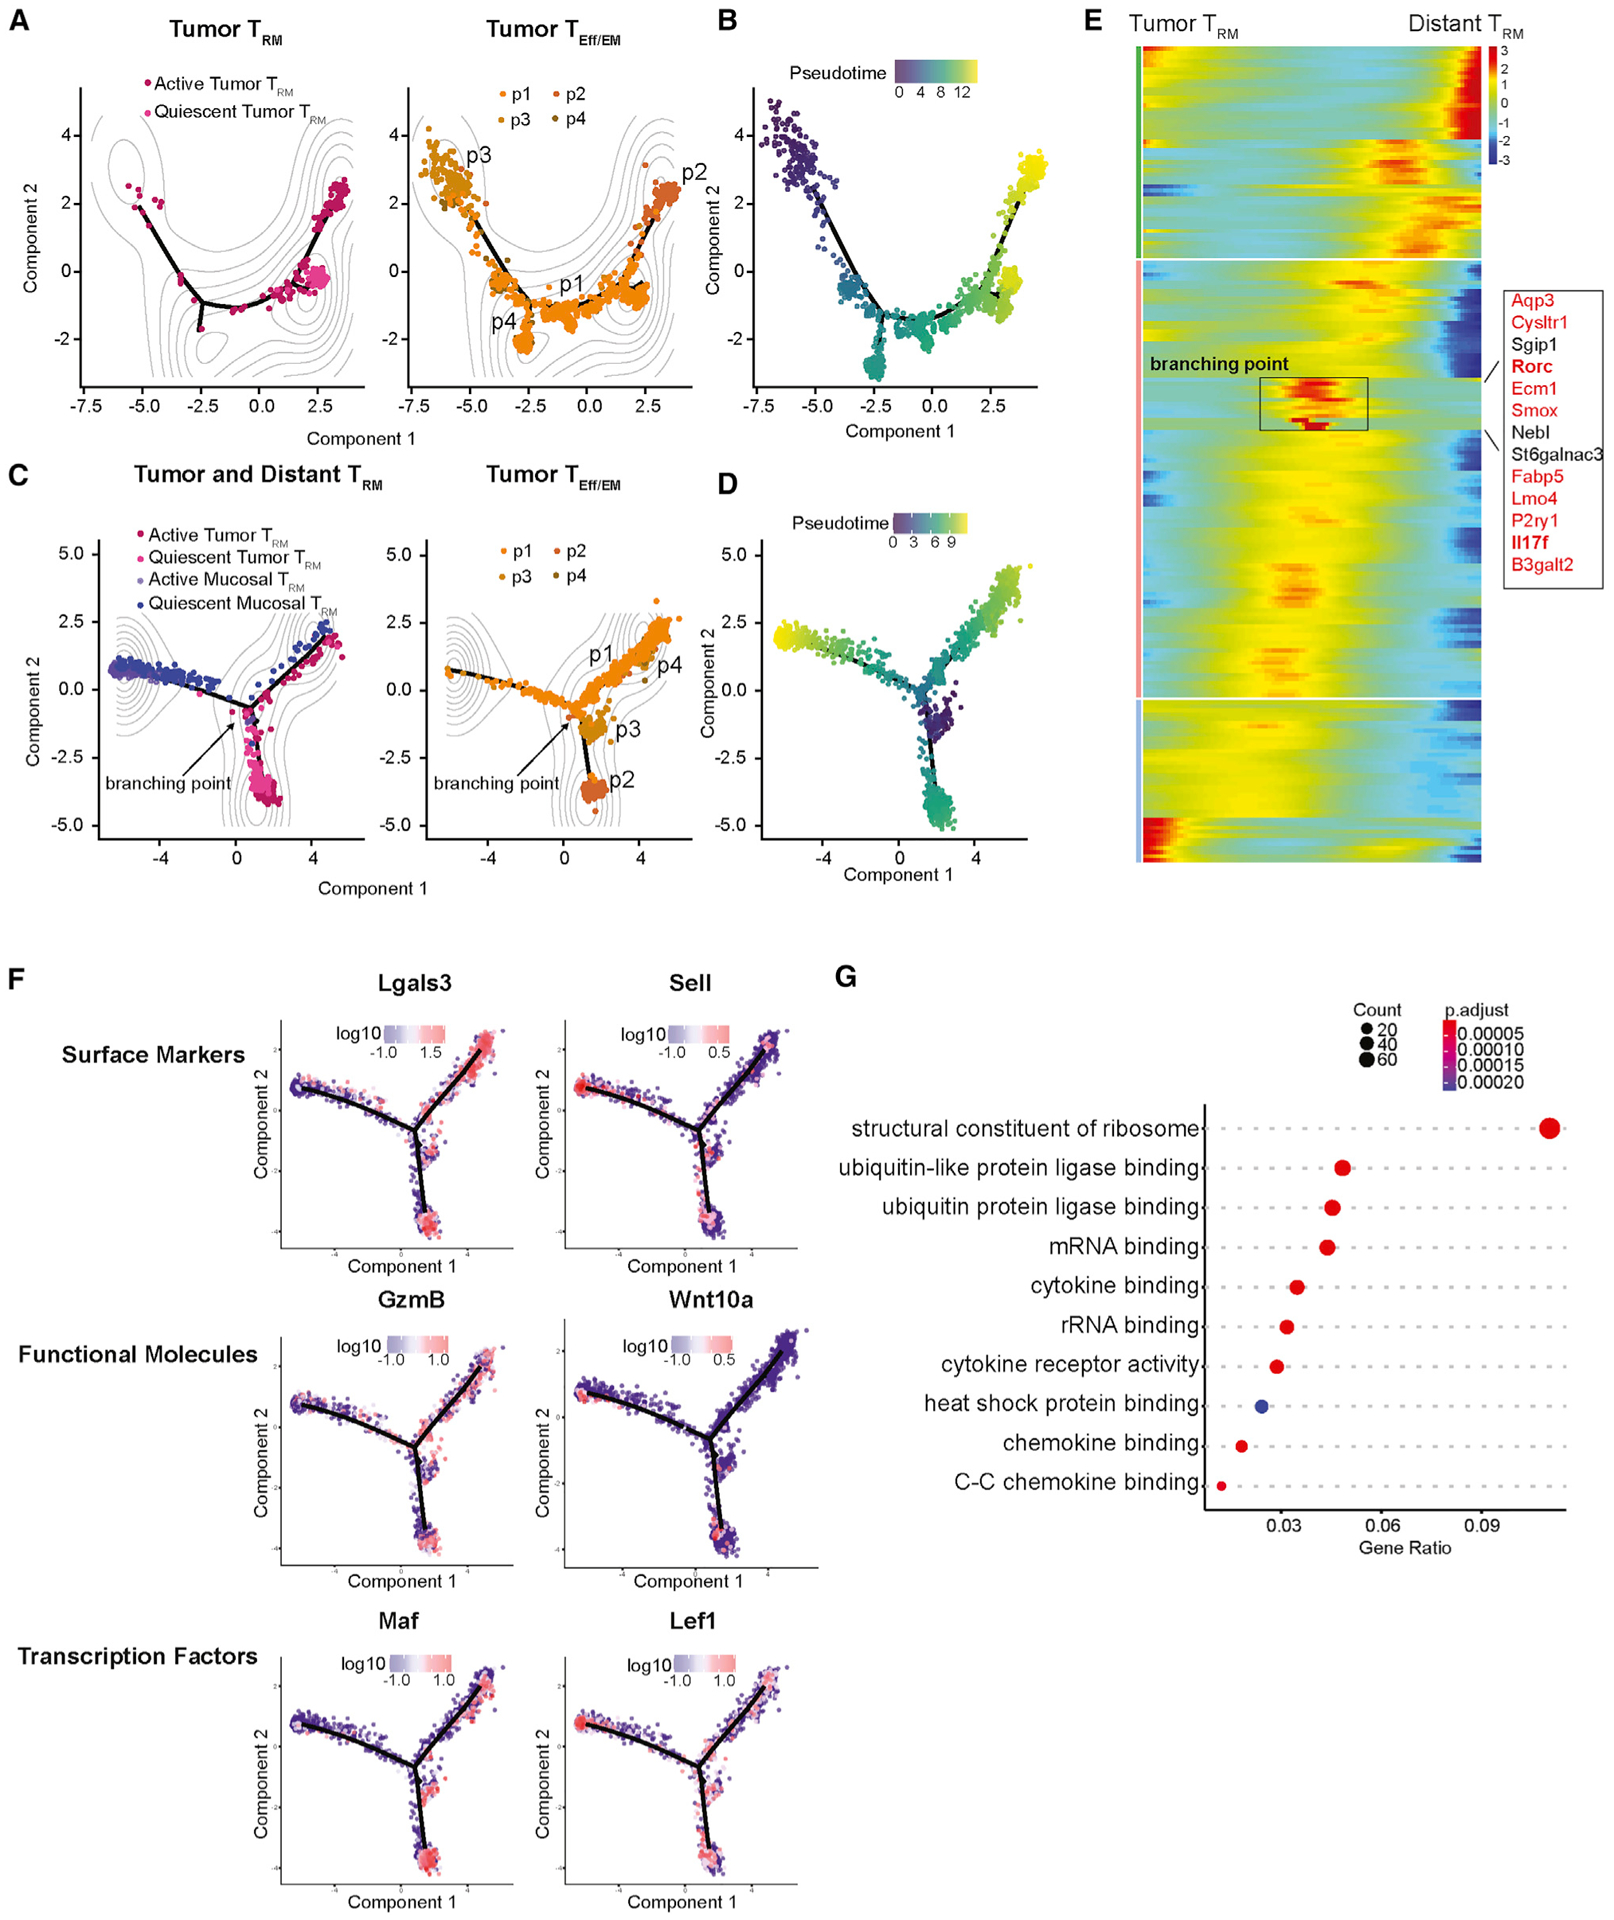
Figure 4. Tissue environment plays a significant role in shaping the formation of TRMs.

(A and B) Monocle2 analysis shows the lineage relationship and progression between the 4 tumor TEff/EM CD8+ subsets and tumor TRMs in (A) contour and (B) pseudotime plot. The main proliferating population (tumor TEff/EM p3) was used as the starting point of pseudotime progression in all of the analyses.
(C and D) Contour (C) and pseudotime (D) analysis of the tumor TEff/EM populations, tumor TRMs, and distant TRMs shows that these populations distinctly separate by their tissue of origin. The divergence of this lineage path is identified at the branching point.
(E) Heatmap of gene expression of the individual T cell subsets approaching and leaving this branch point. A total of 13 critical genes define this branch point, the majority of which (in red) are signature genes identified in the Th17 lineage.
(F) Surface markers Lgals3 and Sell, functional molecules GzmB and Wnt10a, and transcription factors Maf and Lef1 were projected back on the pseudotime space to exemplify the differences between tumor TRMs (left column) and distant TRMs (right column)
(G) Gene Ontology analysis reveals that ribosome pathways were enriched in the distant TRM population, while cytokine and chemokine signaling pathways were enriched in tumor TRMs.
