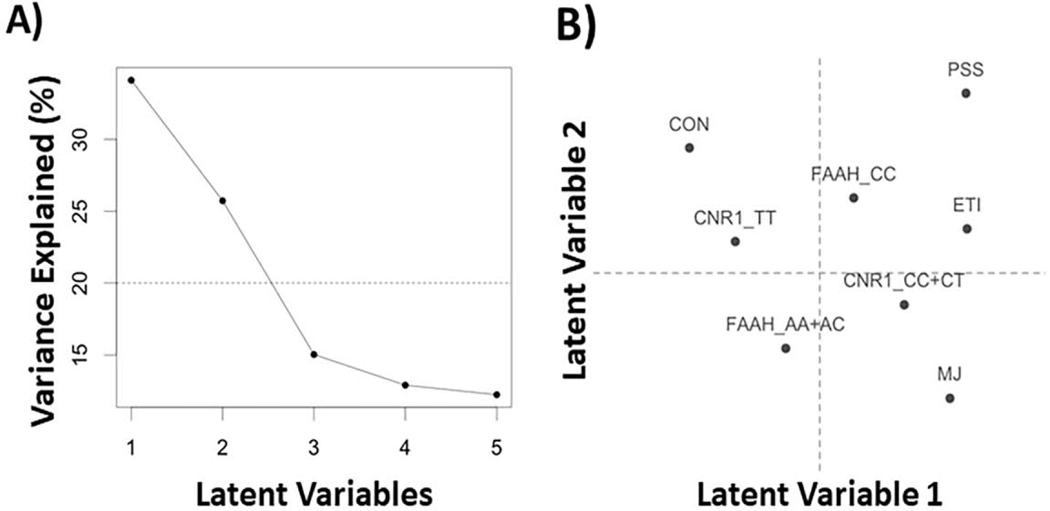
Figure 1:
Scree plot and latent variable (LV) scores for the explanatory variables (i.e., groups, genes, and stress). (A) The scree plot shows the explained variance per LV with a horizontal line as a cutoff for average (expected) variance. (B) The LV scores plot show how each explanatory variable contributes to the first two LVs. ETI=early trauma inventory; PSS=perceived stress scale; MJ=cannabis users; CON=controls

