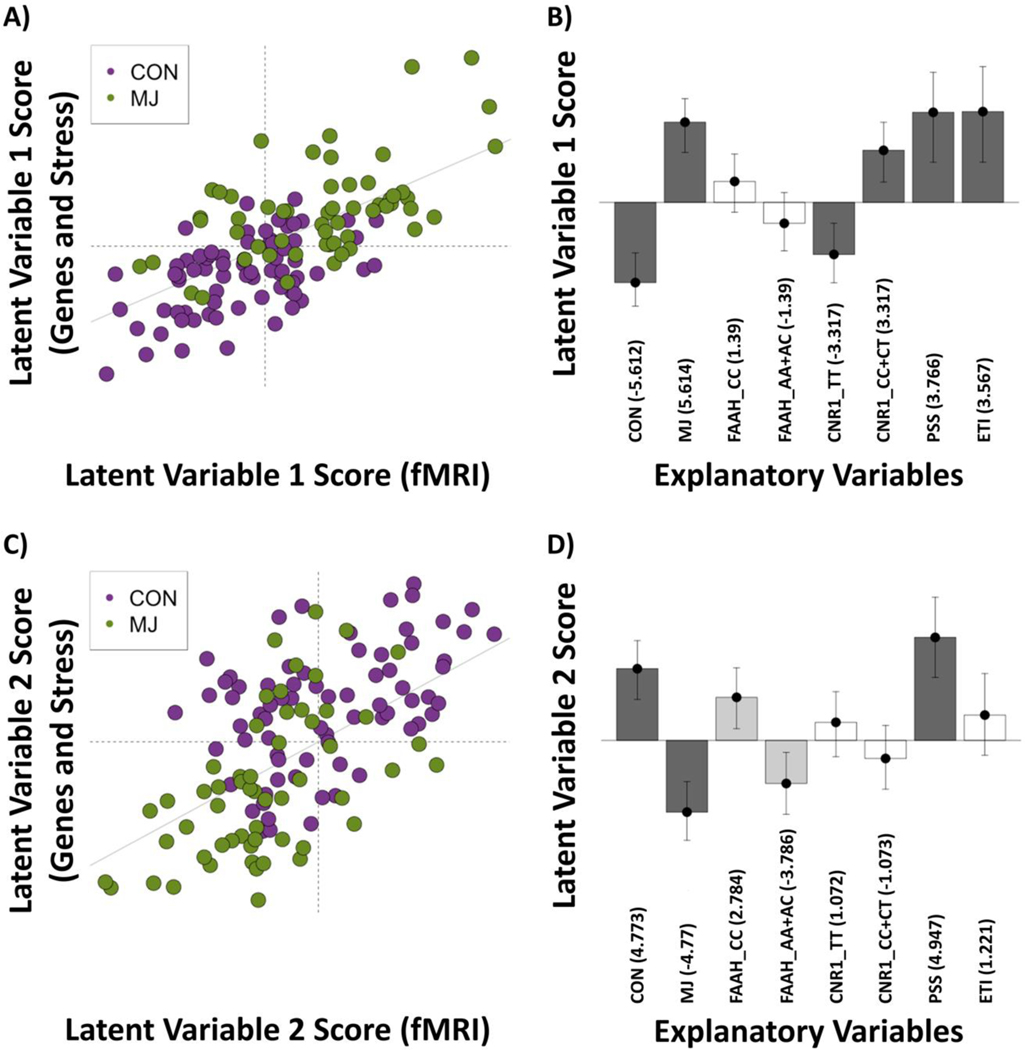
Figure 2:
Latent variable 1 (LV1) and 2 (LV2) scores and loadings. (A) LV1: fMRI scores vs. [38] scores and (B) Loadings for expected variance with bootstrap ratios (BSRs) denoted in parentheses; 95% confidence intervals around loadings shown. The LV plot shows that in general there is a separation of cannabis users (MJ) from controls (CON). The BSRs for the explanatory variables show that the effect is driven by [39] vs. {MJ CNR1 CC/CT, Early Trauma Inventory (ETI), Perceived Stress Scale (PSS)}. (C) LV2: fMRI scores vs. [38] scores and (D) Loadings for explanatory variables with BSRs denoted in parentheses; 95% confidence intervals around loadings shown. The LV plot shows that in general there is a separation of MJ from CON. The BSRs for the explanatory variables show that the effect is driven by {Controls (CON), PSS} vs. [40], with a likely (albeit not significant at BSR > 3) effect of FAAH.
Note: Explanatory variables that load in the same direction are positively correlated.

