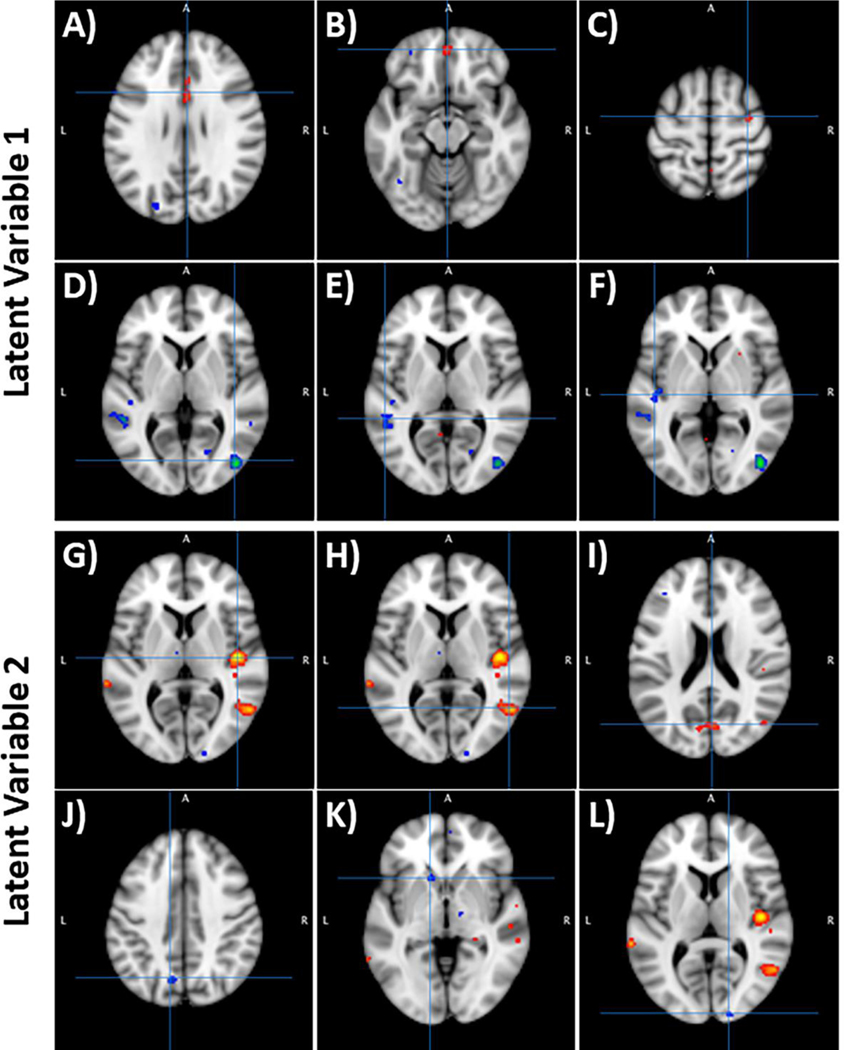
Figure 3:
Clusters associated with latent variables 1 (LV1) and 2 (LV2). Hot colors reflect positive correlations (+ BSR scores), whereas cool colors reflect negative correlations (- BSR scores). A–C (top row) – Activation clusters of LV1 that were associated with the {cannabis users, CNR1 CC/CT, early trauma inventory, perceived stress scale} effects. The top three clusters were in (A) Cingulate Gyrus, (B) Medial Frontal Gyrus, and (C) Precentral Gyrus. D–F (second row) – Activation clusters of LV1 that were associated with the {controls, CNR1 TT} effects. The top three clusters were in (D) Middle and Inferior Occipital Gyrus, (E) Middle and Superior Temporal Gyrus, and (F) Superior Temporal Gyrus and Insula. G–I (third row) - The clusters of LV2 that were associated with {controls, perceived stress scale} effects. The top three clusters were in (G) Superior Temporal Gyrus and Insula, (H) Middle Temporal Gyrus, and (I) Cuneus. J–L (bottom row) - The clusters of LV2 that were associated with the {cannabis users} effects. The top three clusters were in (J) Precuneus and cuneus, (K) Caudate, and (L) Cuneus.

