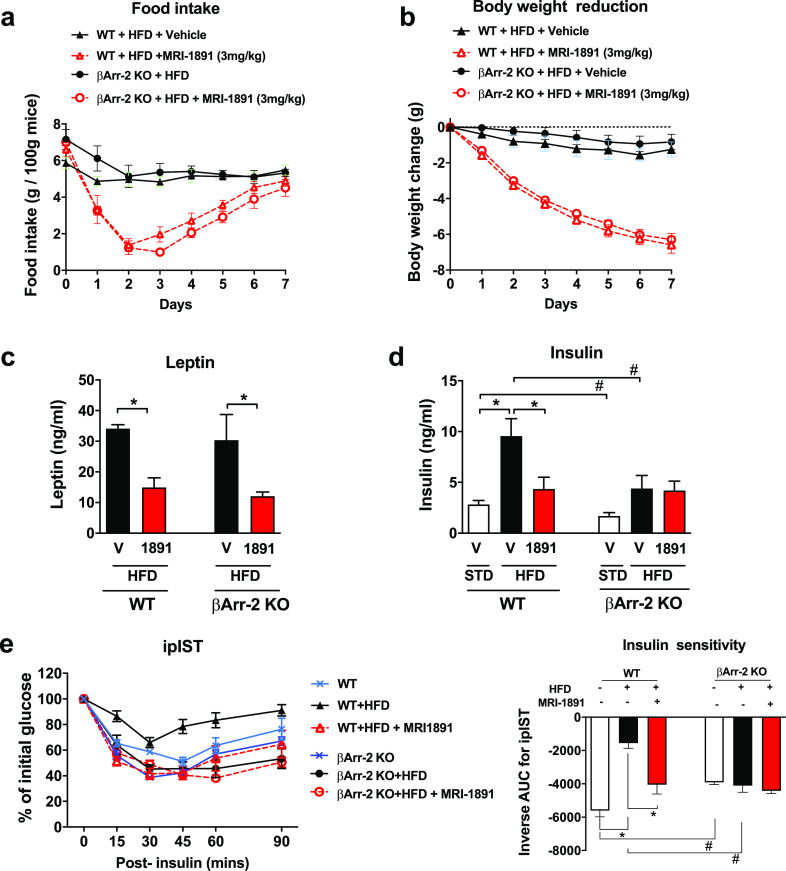
Figure 4.
Effects of (S)-MRI-1891 treatment on food intake (a), body weight (b), plasma leptin (c), nonfasting plasma insulin (d), and insulin sensitivity (e) of male wild-type and βArr2-KO mice with high-fat diet induced obesity. Body weight at the start of treatment was 45.6 ± 0.4 g. Points or columns and vertical lines represent mean ± SEM from 8–10 animals. Intraperitoneal insulin sensitivity test (ipIST) was conducted as described in the Supporting Information. *, significant difference (P < 0.05) within the indicated groups, as determined by 2-way ANOVA followed by Dunnett’s multiple comparisons test. #, significant difference (P < 0.05) between wild-type and βArr-2 KO groups, as determined by 2-way ANOVA followed by Sidaks’s multiple comparisons test.

