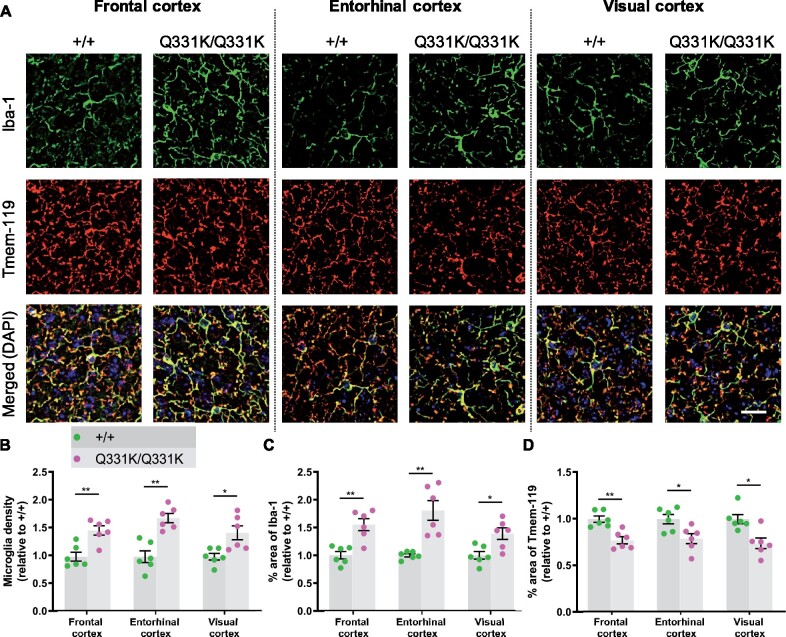
Figure 4.
Global microglial activation in the TDP-43Q331K/Q331K mutant mouse brain. (A) Immunohistochemistry showing microglia marker Iba-1 (green), Tmem119 (red) and DAPI (blue) in indicated regions of 7-month-old +/+ and Q331K/Q331K mouse brains. Scale bar, 20 μm. (B) Quantification of microglia density based on Iba-1 and DAPI immunoreactivity in given brain regions. Comparisons between +/+ and Q331K/Q331K as follows: frontal cortex, ** P = 0.0028; entorhinal cortex, ** P = 0.0012; visual cortex, * P = 0.0113. (C) Quantification of percentage area of Iba-1 in given brain regions. Comparisons between +/+ and Q331K/Q331K: frontal cortex, ** P = 0.0043; entorhinal cortex, ** P = 0.0035; visual cortex, * P = 0.0107. (D) Quantification of percentage area of Tmem119 in given brain regions. Comparisons between +/+ and Q331K/Q331K: frontal cortex, ** P = 0.0039; entorhinal cortex, * P = 0.0174; visual cortex, * P = 0.0122. (B–D) Each dot represents one mouse. P-values were calculated with multiple t-tests adjusted by Holm–Sidak correction. Error bars represent mean ± SEM.

