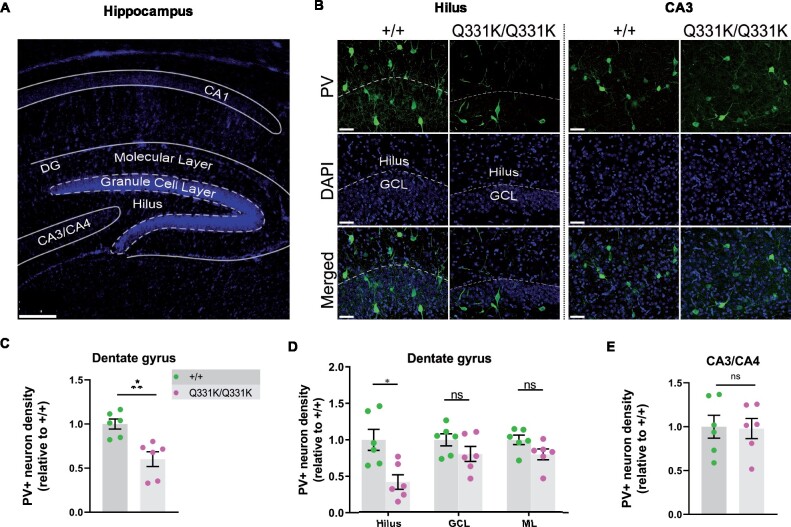
Figure 7.
Paucity of PV+ neurons in hippocampi of P14 TDP-43Q331K/Q331K mice. (A) Low magnification DAPI-stained overview of mouse P14 hippocampal regions. Scale bar, 200 μm. (B) PV+ interneurons shown in given regions of the hippocampus in P14 +/+ and Q331K/Q331K mice. Scale bar, 50 μm. (C) Quantification of PV+ interneuron density in dentate gyrus (DG) comparing +/+ to Q331K/Q331K mice: * P = 0.0142. (D) Of regions within DG, quantification of PV+ interneuron density in hilus comparing +/+ to Q331K/Q331K mice: * P = 0.0315; granule cell layer (GCL): ns P = 0.3133 and molecular layer (ML): ns P = 0.1957. (E) Quantification of PV+ interneuron density in C3 area: ns P = 0.9061. (C, D) Each dot represents one mouse. P values were calculated with multiple t-tests adjusted by Holm–Sidak correction. Error bars represent mean ± SEM.

