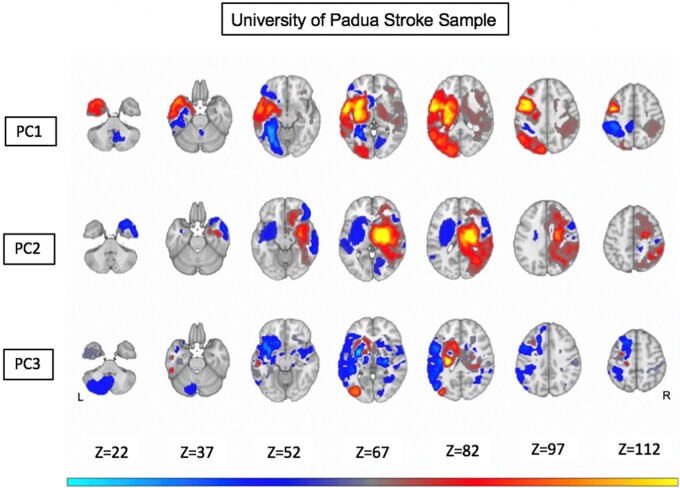
Figure 5.
Ridge regression maps from the University of Padova sample. Warm colours represent positive correlation between anatomical voxels and high PC values (i.e. high level of impairment in the corresponding domains). Cold colours represent negative correlation between anatomical voxels and high PC values. Anatomical overlay maps are shown for PC1, PC2 and PC3 scores, respectively [after Gaussian smoothing (variance = 1) and scaling within ; weights lower than 0.05 in absolute values are not shown].

