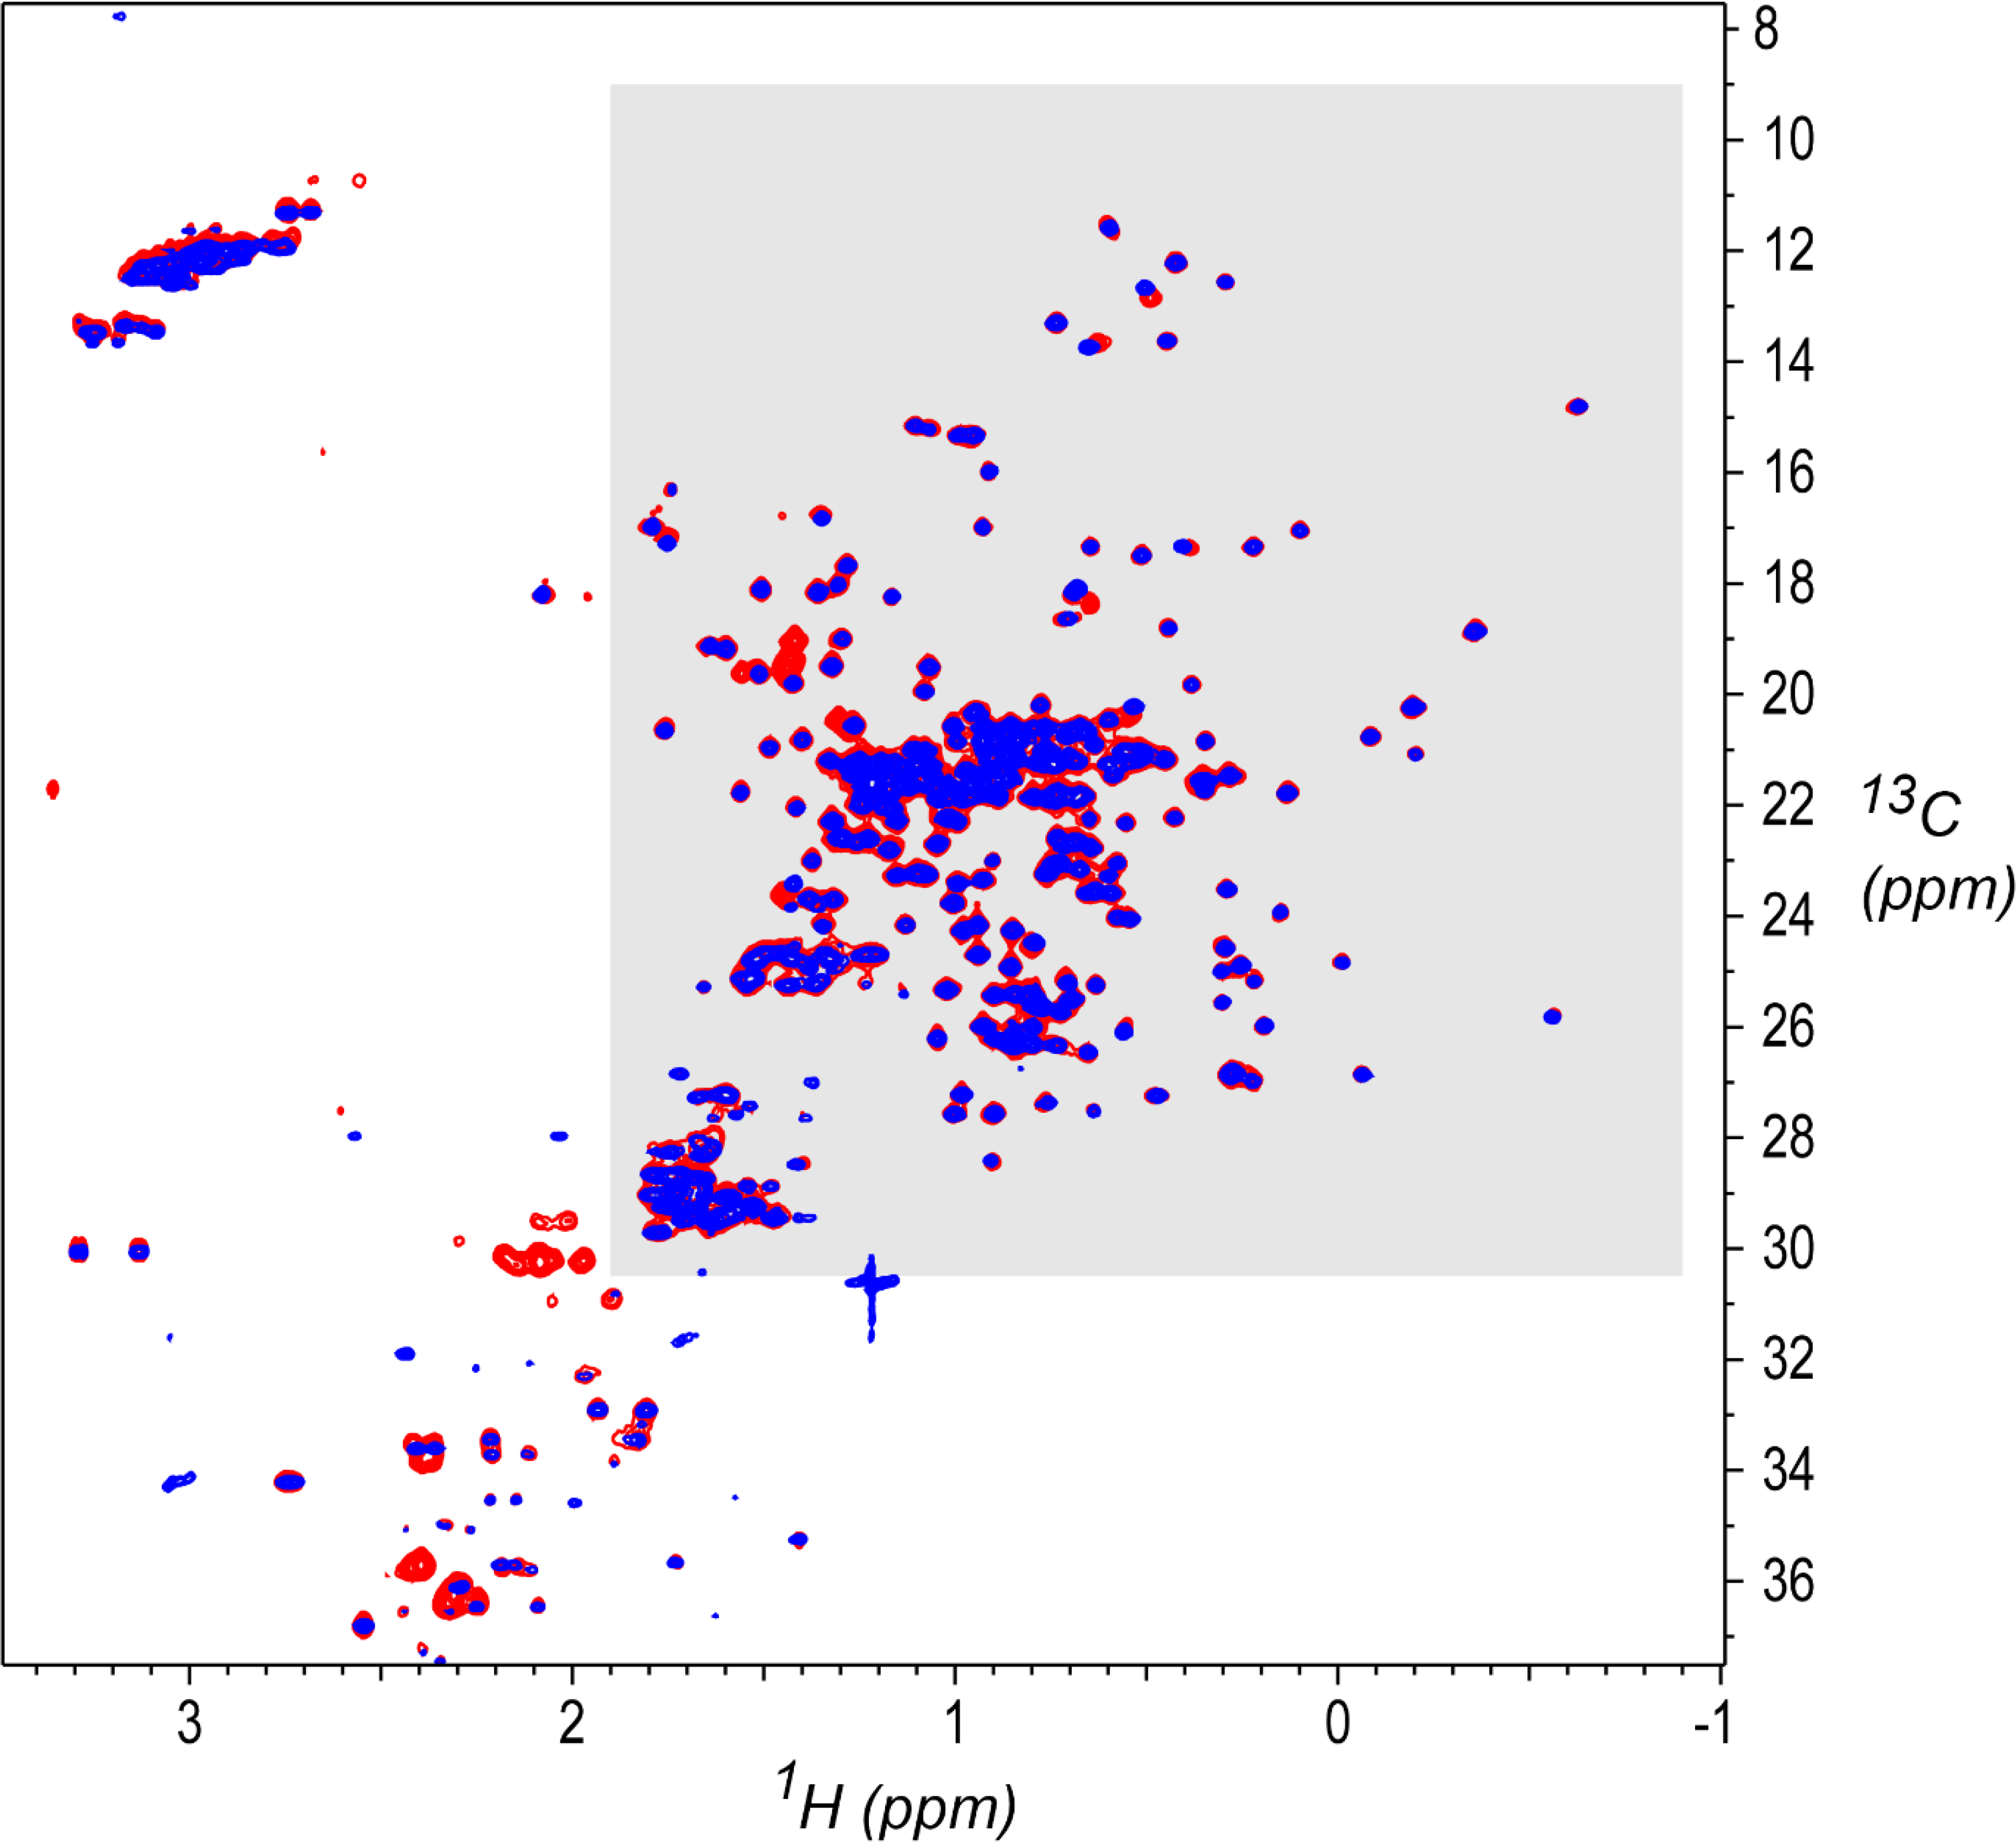
Figure 1.

1H,13C gHSQC[33] spectral overlay for a System Suitability Sample (red, study ID 001-D2C-S-U-900–8822-010–37C) and a NIST-Fab sample (blue, study ID 004-D3A-F-U-900–7425-015–37C).[2] The study IDs encode the sample and measurement details in a series of fields separated by dashes, in this order from left to right: unique study index number, experiment code (as given in Table 1), sample (F for NIST-Fab, S for System Suitability Sample), NMR sampling type (U for Uniform, N for Non-Uniform), spectrometer frequency in MHz, laboratory ID, spectrum ID within that laboratory, and measurement temperature. Contour levels start at 2.5% of maximum intensity. The region shaded in gray, consisting primarily of protein sidechain methyl signals, was used for the outlier analysis in the present work (1H 1.9 ppm to −0.9 ppm, 13C 30.5 ppm to 9.0 ppm). Spectra were acquired as detailed by Brinson et al.,[2] and processed as described there by NMRPipe.[38]
