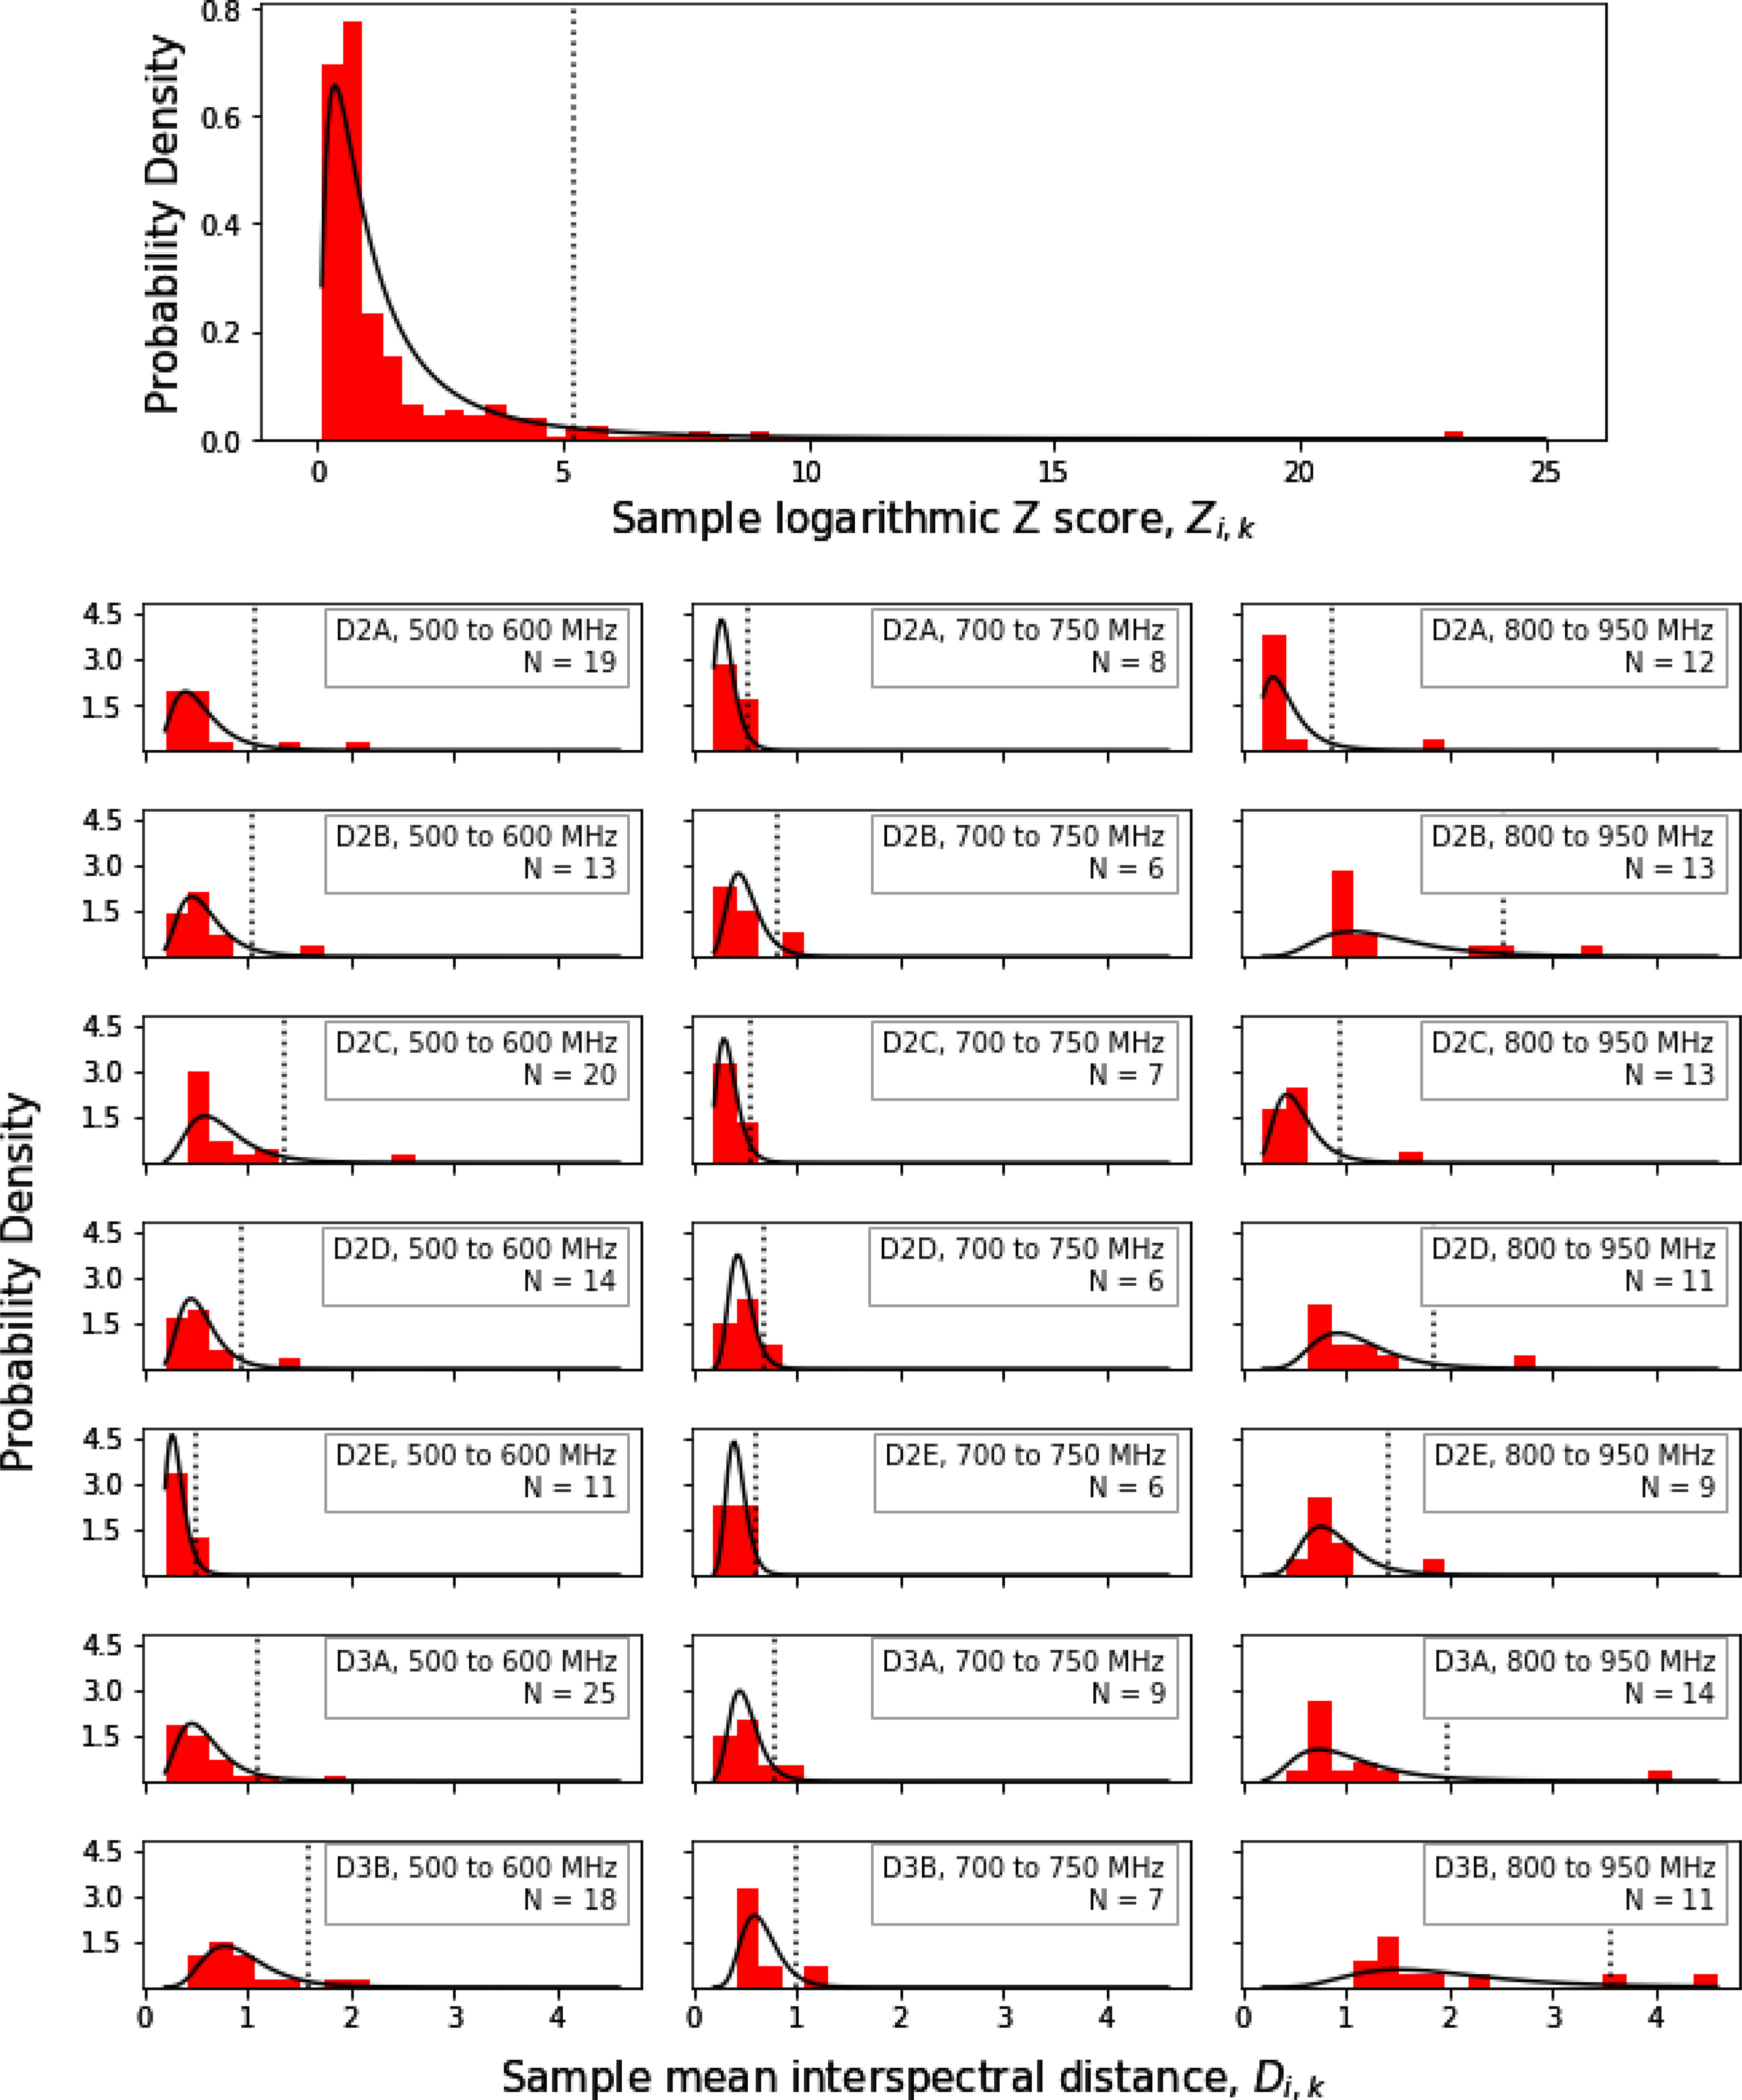
Figure 5.

Example probability distributions for classes used for the outlier detection procedure. The topmost graph shows the distribution for all spectra, the other graphs show the distributions for each of the 21 classes used. The red histograms show the actual distribution of the measured data, and the black curves show the fit of the histograms to lognormal distributions. In a given distribution, spectra which fall to the right of the dashed line, representing the 95% confidence limit of the distribution, are classified as outliers.
