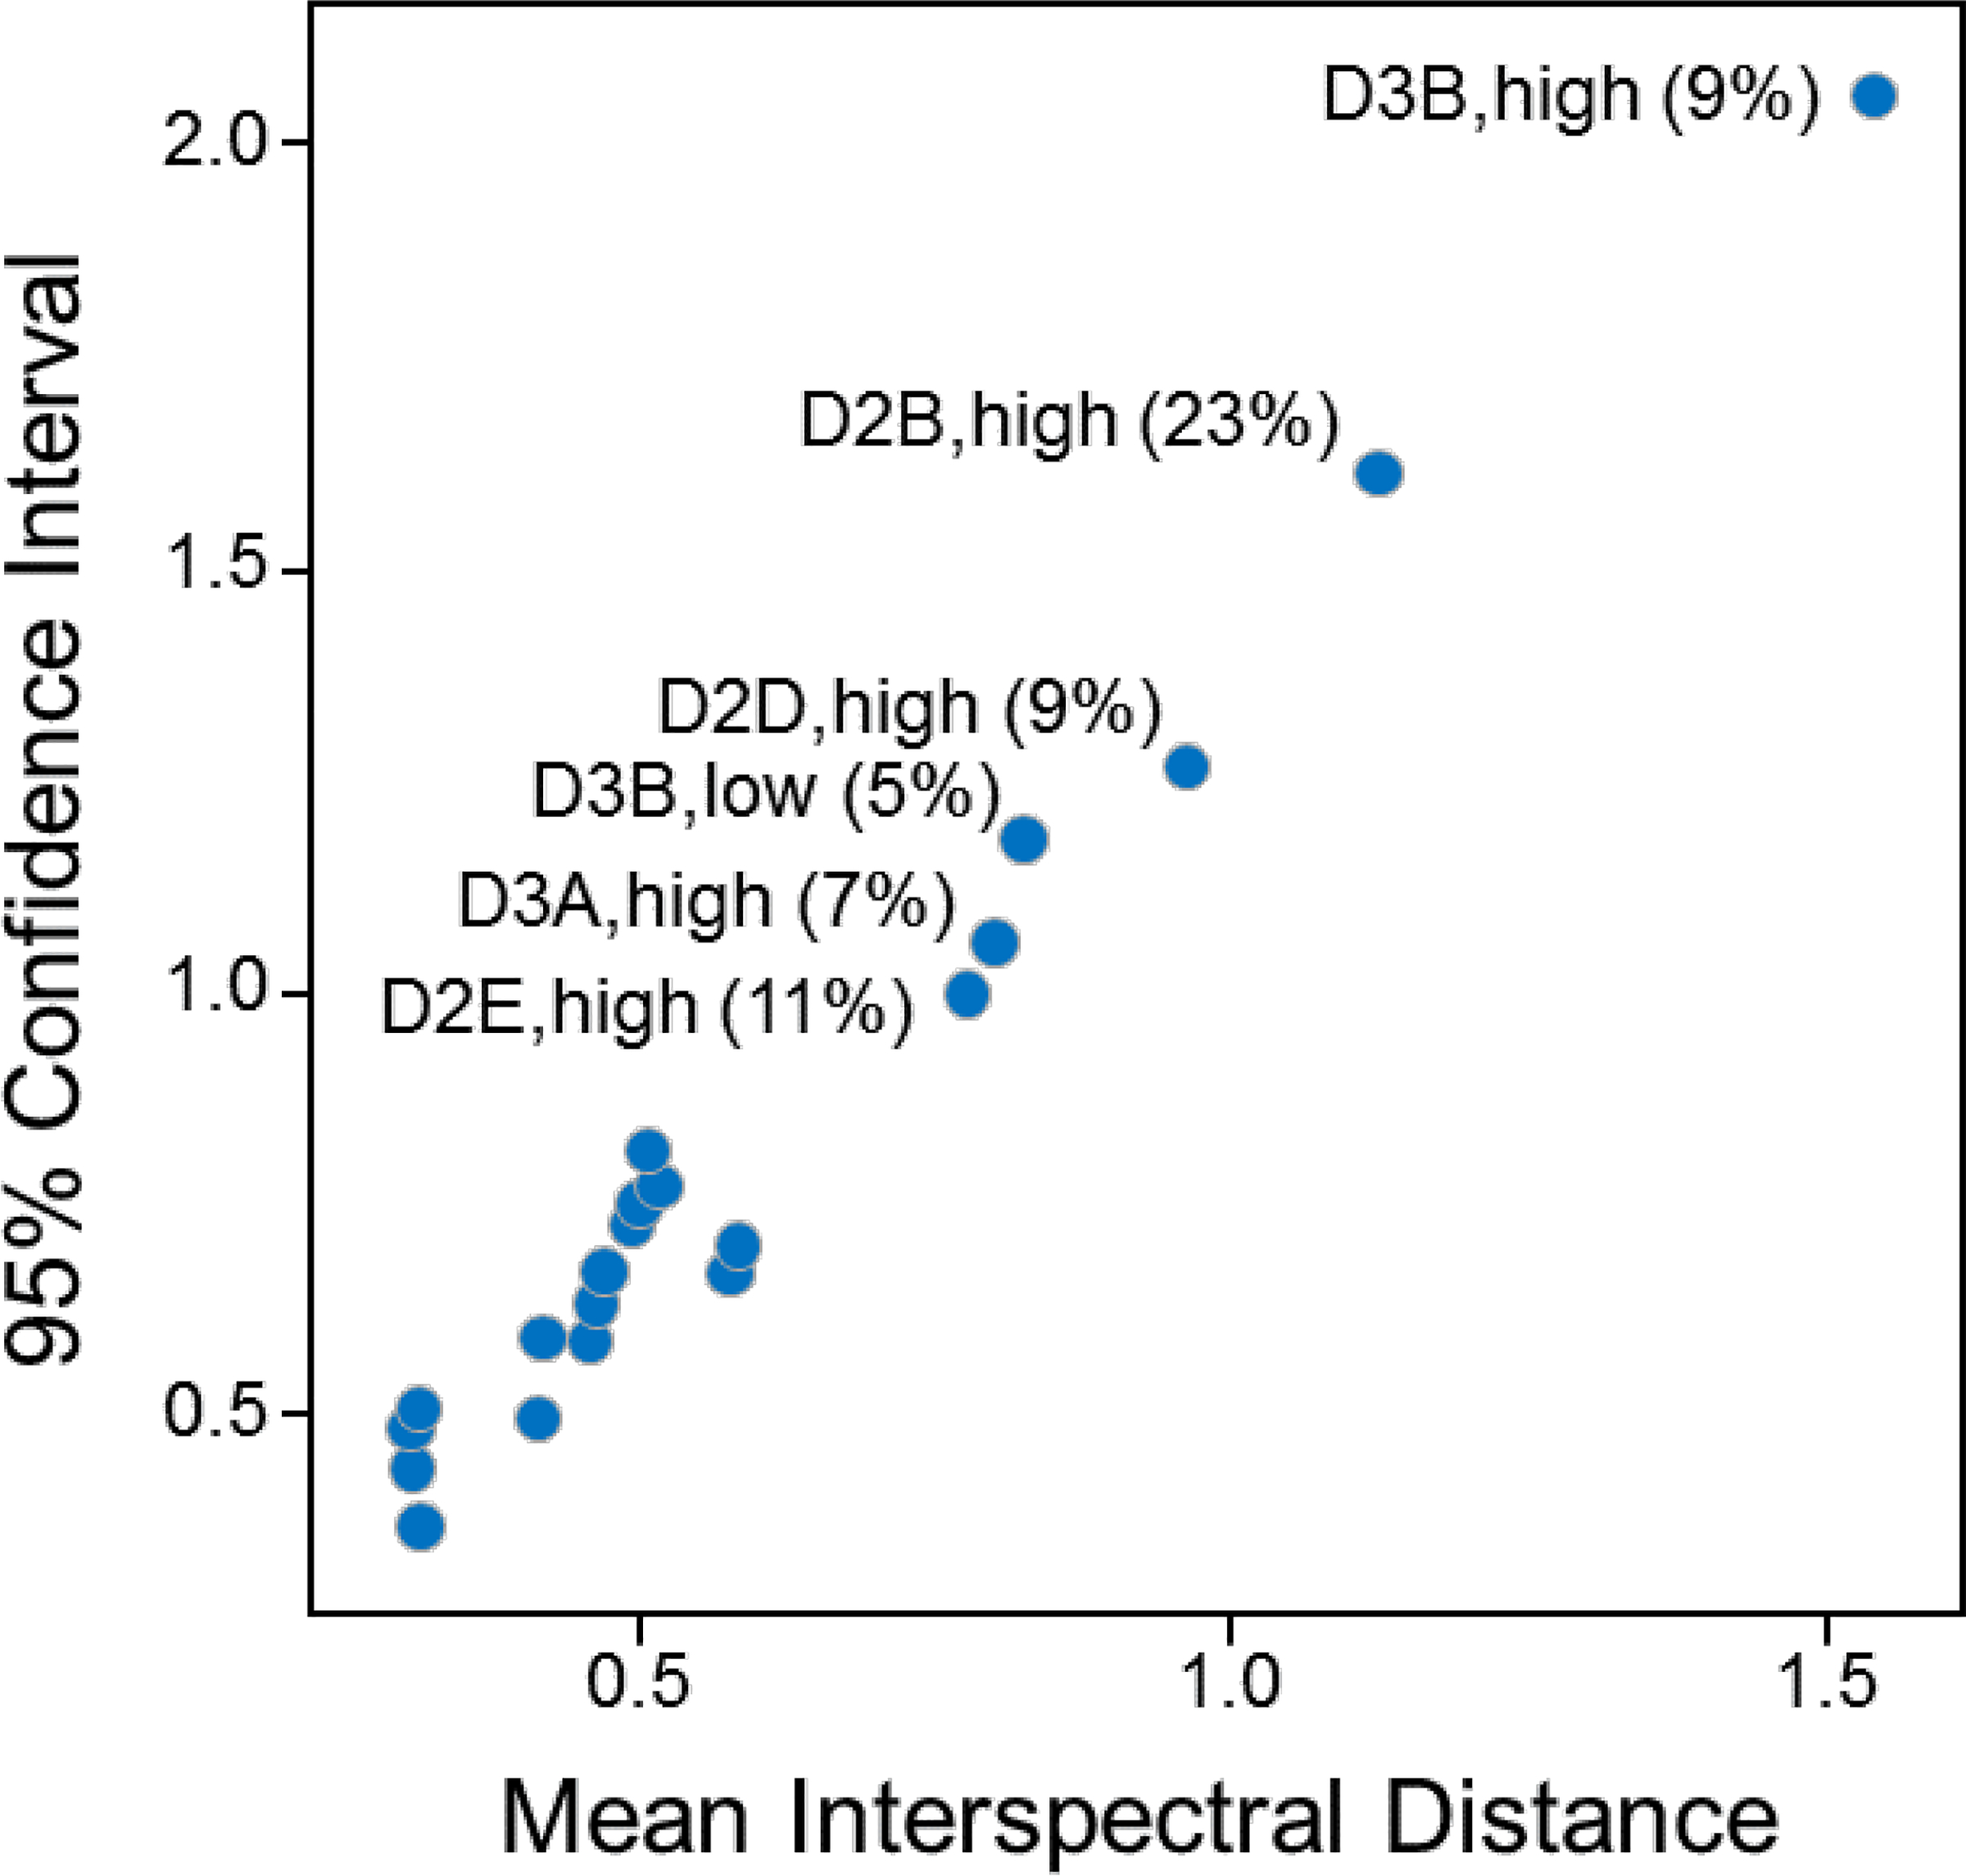
Figure 6.

Example probability distribution parameters for classes used in the outlier detection procedure, with selected points labeled with the class name and percentage of visually identified outliers in that class. The presence of outliers in a class will tend to increase the mean interspectral distance and the width of the confidence interval, as for the class D2B,high which has three visually identified outliers out of 13 spectra, as listed in Table 3.
