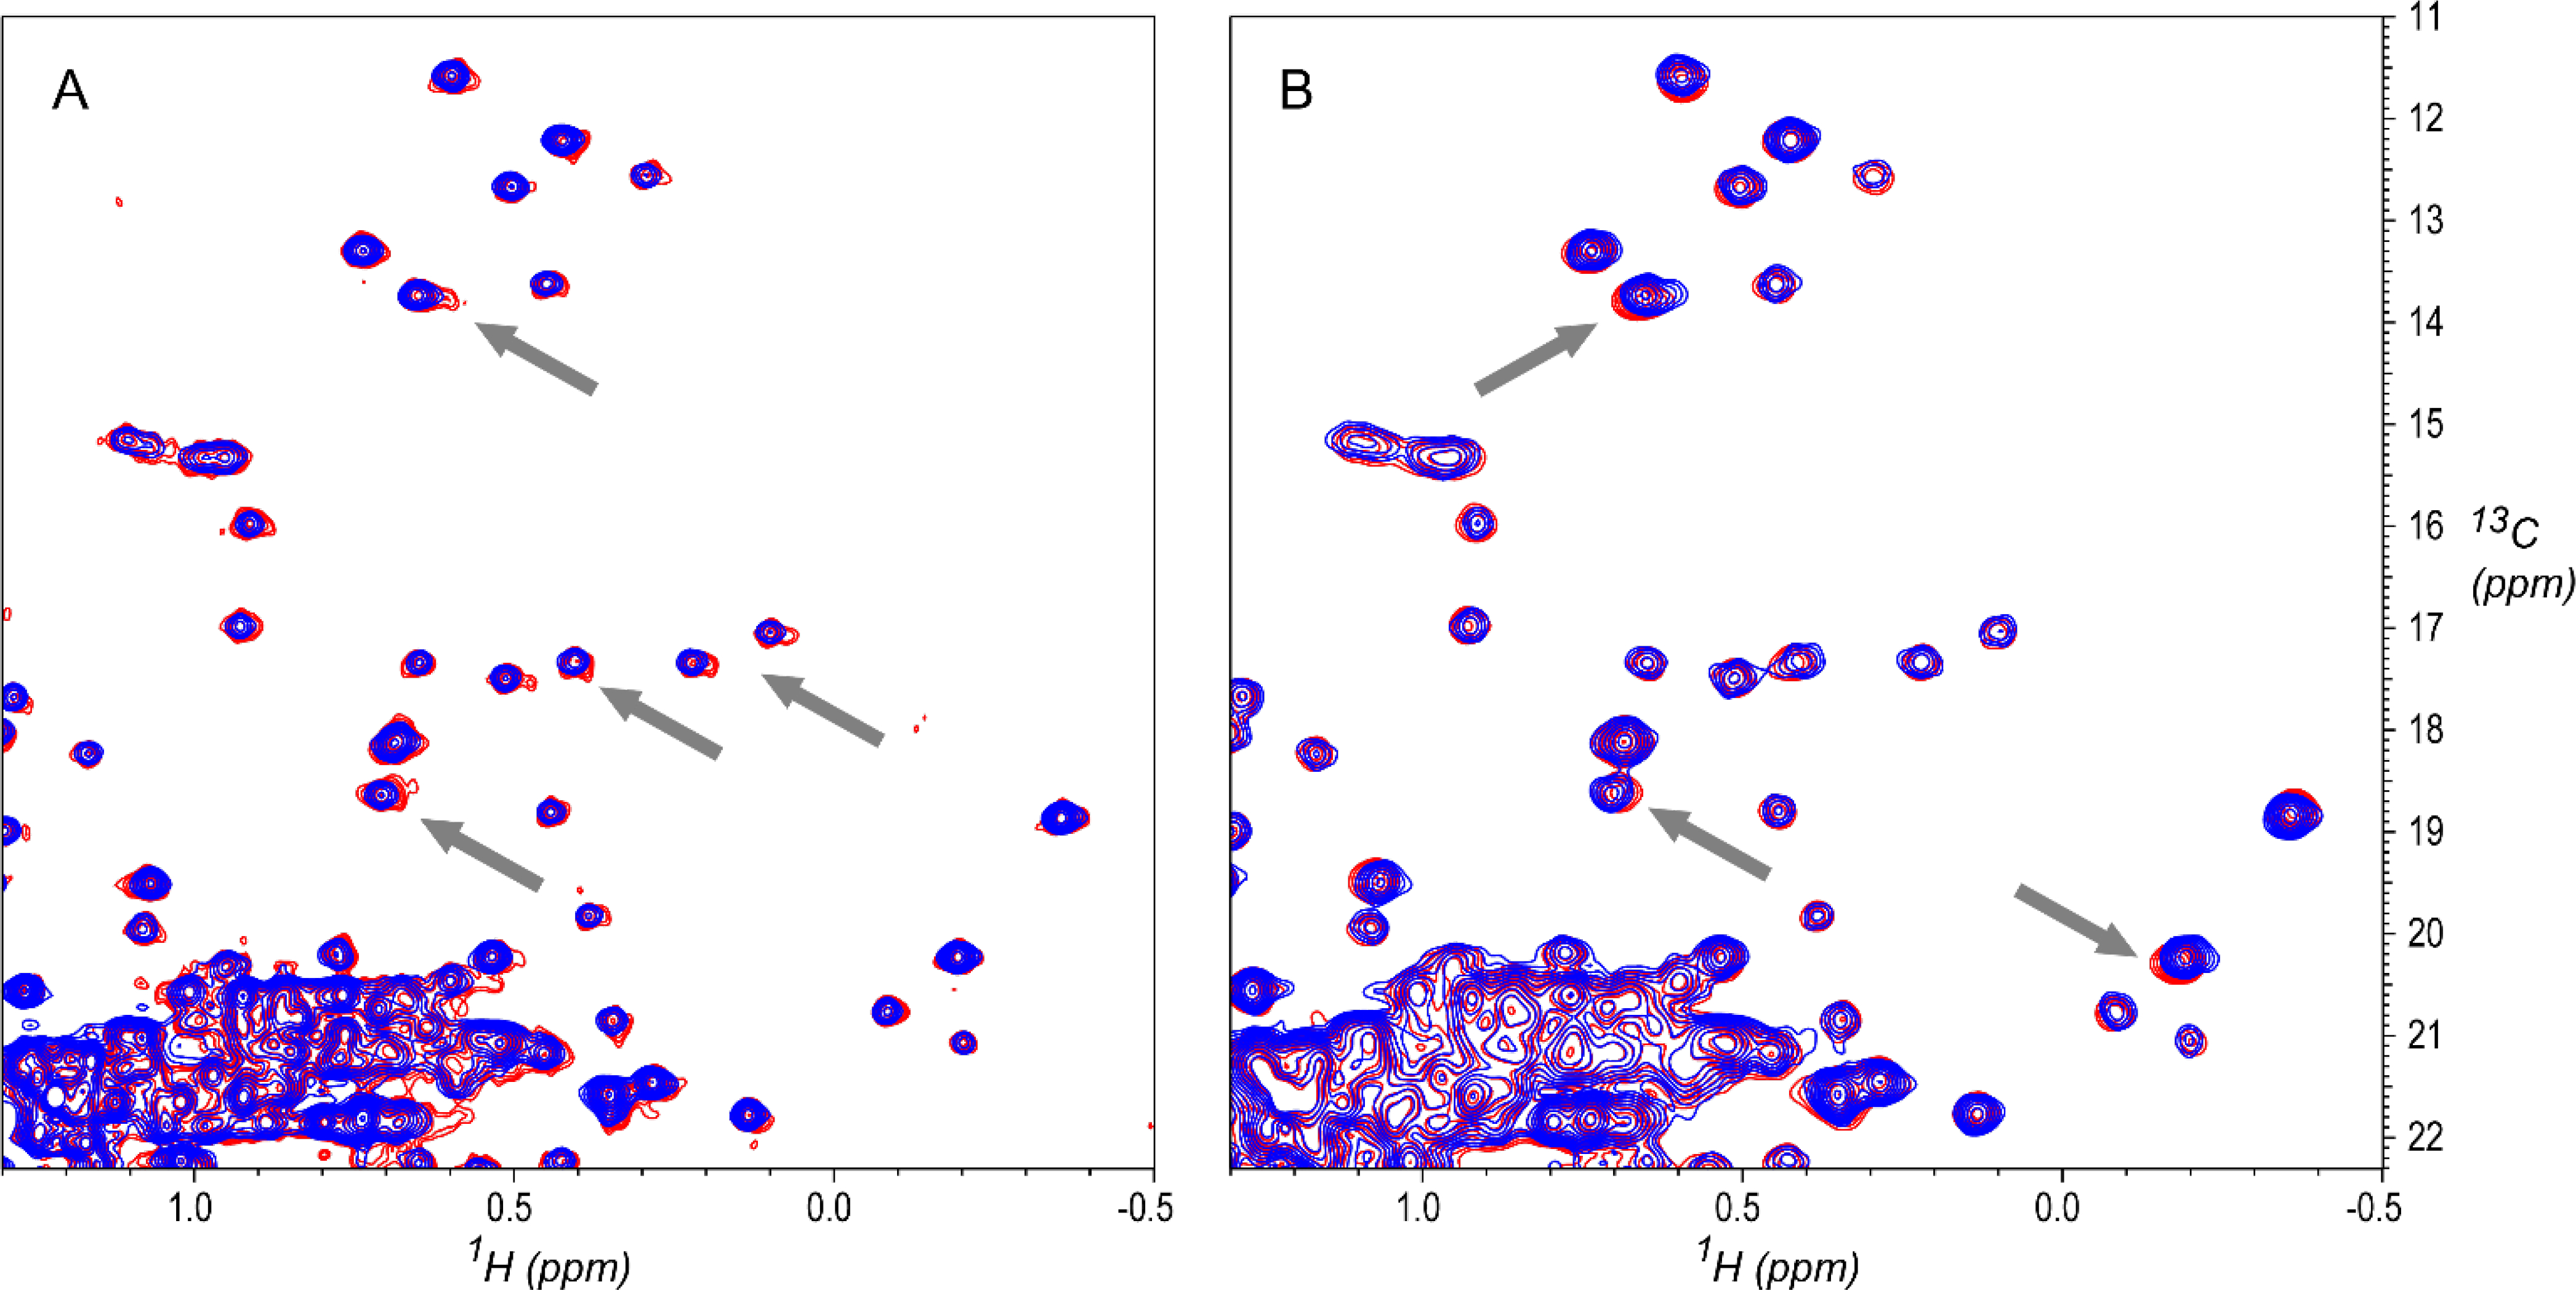
Figure 9.

A: Overlay of outlier spectrum 69 (D3A-F-U-700–8473-007–37C) and a reference spectrum 76 (D3A-F-U-700–8543-007–37C). Spectrum 69 has small systematic lineshape distortions (examples at gray arrows). Spectrum 69 is also seen as an outlier in PCA results, with the largest component 2 score in the PCA plot of Figure 8. B: Overlay of outlier spectrum 173 (D3A-F-U-500–8179-307–37C, red) and a reference spectrum 177 (D3A-F-U-500–9966-006–37C, blue), showing changes in peak positions that are characteristic of different measurement temperatures (gray arrows). Spectrum 173 is one of several identified by Brinson et al. as a temperature outlier (a spectrum recorded at the wrong temperature).[2] Contours are drawn starting at 2.5% of maximum intensity.
