Fig. 2.
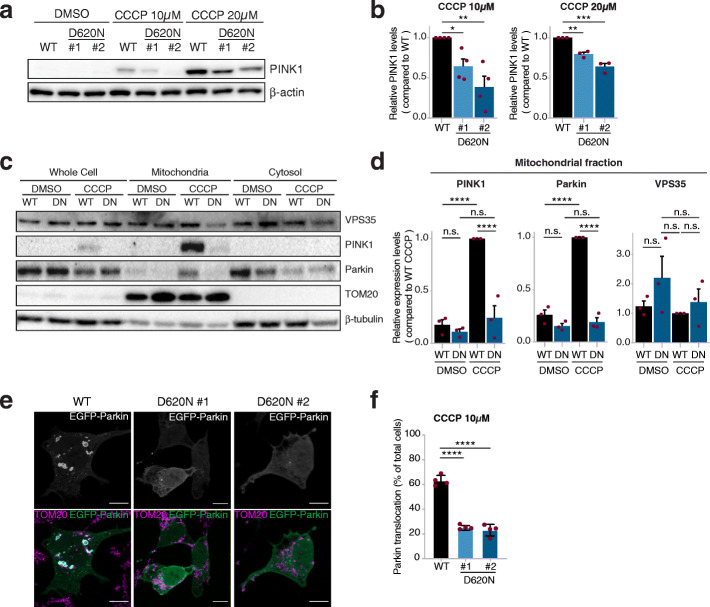
CCCP-induced PINK1/Parkin recruitment is impaired in VPS35D620N cells. a Representative immunoblots for PINK1 in WT and VPS35D620N (clone 1 and clone 2) cells treated with DMSO, 10 μM or 20 μM CCCP for 24 h. b Quantification of PINK1 levels from immunoblots in (a). Shown are relative PINK1 levels after 10 μM or 20 μM CCCP stimulation for 24 h compared to WT cells. Note that PINK1 levels were not quantifiable when treated with DMSO and thus comparisons were made within each treatment condition. Each red dot depicts a separate experiment. Statistical analyses were performed by one-way ANOVA followed by Tukey’s post-hoc test. c Representative immunoblots for VPS35, PINK1, Parkin, TOM20 (mitochondrial loading control) and β-actin (total protein loading control) using protein extracts derived from whole cell, crude mitochondrial fractions or cytosolic fraction from WT and VPS35D620N cells treated with either DMSO or 10 μM CCCP for 6 h. d Quantification of PINK1, Parkin and VPS35 in the mitochondrial fraction from the immunoblots in (c). Shown are relative levels compared to the WT cells treated with CCCP. Each red dot depicts a separate experiment. Statistical analyses were performed by two-way ANOVA followed by Tukey’s post-hoc test. e Representative fluorescence images of cells transiently overexpressing EGFP-Parkin (upper panels: white, lower panels: green), which were also stained for the mitochondrial protein TOM20 (lower panels: magenta). WT cells with EGFP-Parkin translocated onto mitochondria are shown in the left panels and VPS35D620N cells showing a diffuse cytosolic distribution of EGFP-Parkin are shown in the middle (clone 1) and right (clone 2) panels. Scale bar, 10 μm. f Quantification of WT and VPS35D620N (clone 1 and clone 2) cells with EGFP-Parkin translocation to mitochondria, as shown in (e), after 10 μM CCCP stimulation for 24 h, represented as fraction (%) of all counted cells. Red dots represent the means of four different experiments in which at least 50 cells were counted. Data were analyzed using a beta regression. *P < 0.05, **P < 0.01, ***P < 0.005, ****P < 0.001

