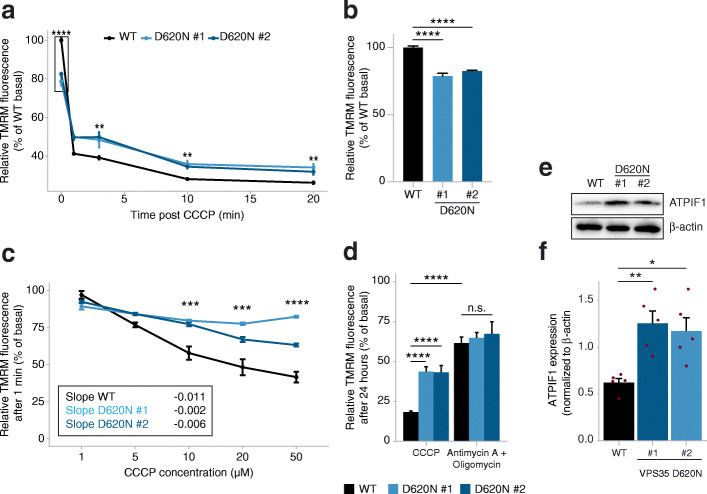
Fig. 6.
VPS35D620N cells are less susceptible to CCCP-induced mitochondrial depolarization. a Measurements of mitochondrial membrane potential of WT and VPS35D620N (clone 1 and 2) cells by TMRM fluorescence at basal level and at 1, 3, 10 and 20 min after treatment with 10 μM CCCP. b Basal TMRM levels from boxed area highlighted in (a). c TMRM fluorescence was measured 1 min after treatment with 1, 5, 10, 20 or 50 μM CCCP. Shown data are relative to basal conditions of each cell line. Slopes were determined using a simple linear regression. d TMRM fluorescence was measured 24 h after treatment with 10 μM CCCP or 1 μM antimycin A and 1 μM oligomycin. Shown data are relative to basal conditions of each cell line. Statistical analyses were performed using two-way ANOVA followed by Tukey’s post-hoc test. e Representative immunoblots of protein extracts from WT and VPS35D620N (clone 1 and clone 2) cells at steady state. Blots were stained with ATPIF1 and β-actin (total protein loading control) antibodies. f Quantification of ATPIF1 levels from immunoblots in (e). Each red dot depicts a separate experiment. Statistical analyses were performed by one-way ANOVA followed by Tukey’s post-hoc test. *P < 0.05, **P < 0.01, ***P < 0.005, ****P < 0.001

