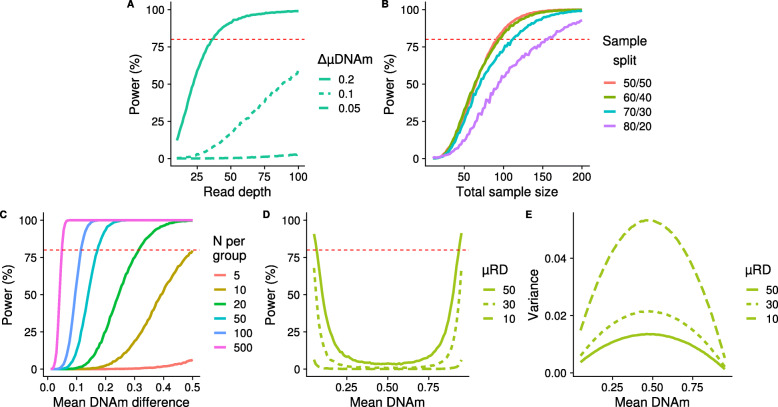
Fig. 6.
Power is influenced by read depth, sample size, and mean DNAm level in two-group comparisons. Power curves plotting statistical power to detect significant differences in DNAm between two groups as a function of a read depth, b sample size and the effect of an unbalanced sample size between groups, c the mean difference in DNAm between the groups and d the mean DNAm at simulated DNAm sites. e The variance for the simulated data shown in panel d. Simulations were performed 10,000 times with a negative binomial parameter of r = 1.5

