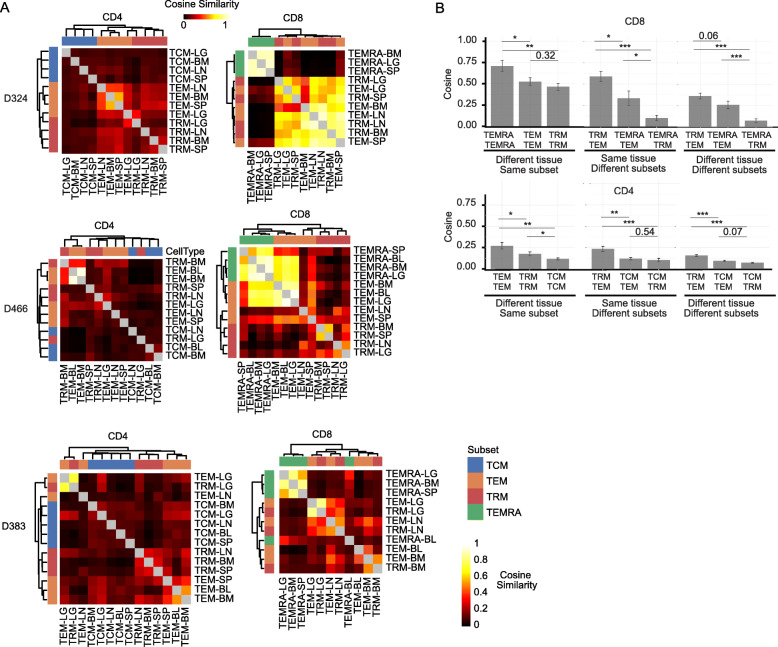
Fig. 3.
Clonal overlap analysis reveals patterns of dissemination and relatedness between circulating and tissue memory subsets. A Cosine similarity between pairwise cell populations of CD4+ (left) and CD8+ (right) T cell subsets (TCM, TRM, TEM, and TEMRA) from blood and tissues (Lung (LG), bone marrow (BM), lymph node (LN), spleen (SP)) of donor 324 (top), donor 466 (middle), and donor 383 (bottom). Dendrogram created using complete linkage method. Each cell represents the mean of the cosine similarity of replicate samples with the magnitude (min = 0, max = 1) depicted as a heat map. B Compiled cosine similarity between subsets and tissues. Average cosine similarly (±SEM) between the same subset in any two sites (BL, BM, SP, LG, or LN) (left), between different subsets within a single site (middle) or between different subsets in different sites (right) for CD8+ (upper) and CD4+ (lower) T cells

