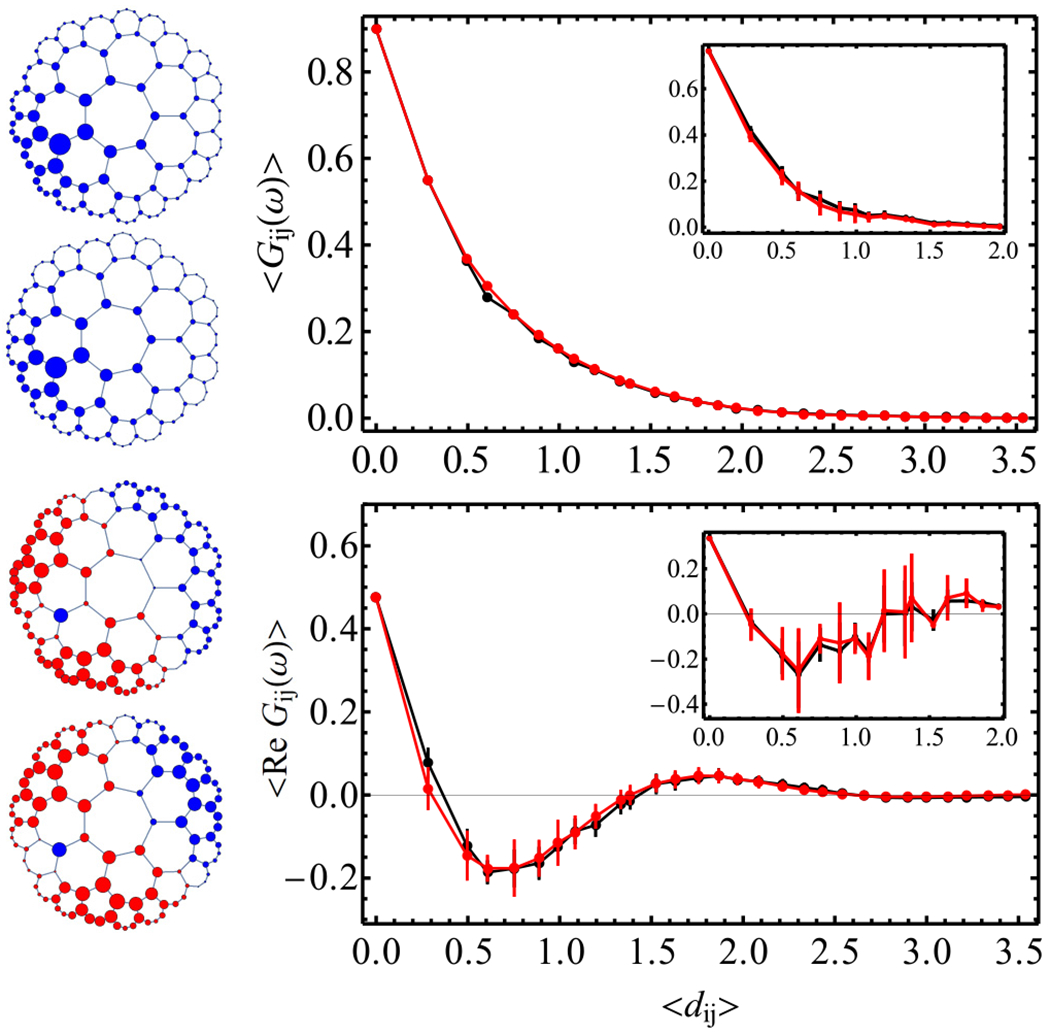
FIG. 4.

Quantitative match between graph Green function Gij and continuum Green function G(zi, zj). We fix site zi to be on the second ring, and plot the correlations as a function Fj of site zj. Upper panel: Results for ω = −2.95 just below E0. Left: The two plots are Fj = Gij and Fj = G(zi, zj). The size of dots is proportional to |Fj|1/2, and blue (red) corresponds to positive (negative) sign of Fj. Right: Mean correlation function vs hyperbolic distance dij = d(zi, zj), where the red (black) data are the graph (continuum) function. To obtain the curves, we make a list of pairs (Fj, dij) and compute the average Fj as a function of distance, with the error bar being the standard deviation. The quantitative agreement between graph and continuum is remarkable. Emergent conformal symmetry is reflected by the data points collapsing onto a single curve Gij = f(dij) with some function f for large ℓ. The main plots are for ℓ = 6, the insets for ℓ = 3. Lower panel: The same setting for ω = −2.5 + 0.1i with Re(ω) > E0. We plot the real part of the correlation function.
