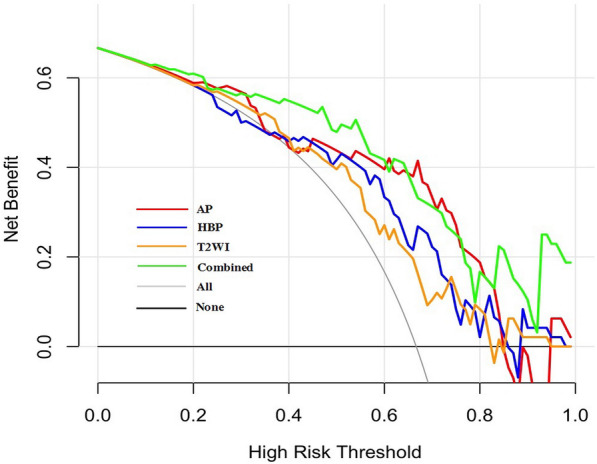
Fig. 3.

Decision curve analysis of the AP, HBP, T2W radiomics model and combined radiomics model in the validation cohort. The red line, blue line, yellow line, and green line represent the AP, HBP, T2W and the combined radiomics model, respectively. The combined model includes AP Rad-score and serum AFP level. The curve of AP radiomics model was generally higher than that of HBP and T2W radiomics model. Decision curve shows that at a range threshold probability of 30-60 %, the combined model is optimal decision-making strategy to add the net benefit compared with AP radiomics model only
