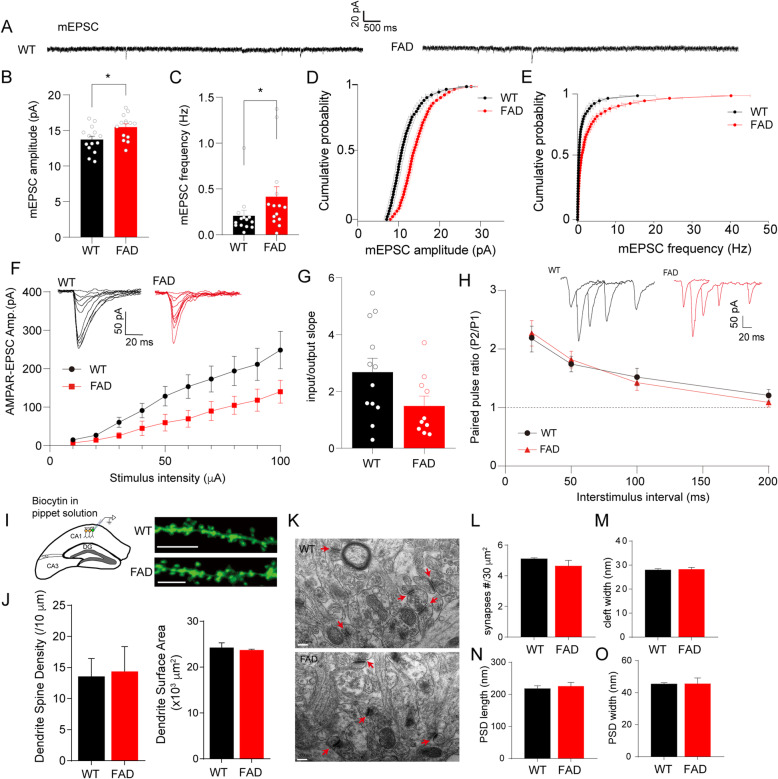
Fig. 2.
The activity-dependent excitatory synaptic responses and spine morphology exhibited no obvious change in CA1 pyramidal neurons of 5XFAD mice at 2.5 months old. A Representative traces show miniature EPSCs (mEPSCs) in CA1 pyramidal neurons from WT or 5XFAD mice. B, C Amplitude (B) and frequency (C) of mEPSCs were analyzed, n(WT) = 14 neurons/7 mice, n(FAD) = 14 neurons/9 mice. For amplitude, the data were subjected to a two-tailed unpaired t-test, *p = 0.0153 for FAD (15.47 ± 0.46 pA) vs. WT (13.72 ± 0.49 pA); for frequency, the data did not pass normality tests and were subjected to a Mann–Whitney test, *p = 0.0301 for FAD vs. WT. D, E Cumulative probability plots show the distribution of amplitude and frequency of mEPSCs in WT and 5XFAD neurons. F Analysis of input–output (I-O) relationship between AMPAR EPSCs and incremental stimulation intensities (in μA) 10, 20, 30, 40, 50, 60, 70, 80, 90, and 100 (WT, 14.67 ± 3.90, 26.98 ± 5.44, 60.64 ± 13.2, 91.02 ± 18.94, 128.40 ± 25.29, 153.60 ± 30.76, 173.30 ± 33.78, 194.10 ± 37.97, 211.50 ± 41.79, 248.66 ± 48.79, respectively, n = 12 neurons/7 mice; FAD, 6.88 ± 1.07, 14.01 ± 3.66, 25.81 ± 7.81, 44.86 ± 18.73, 59.63 ± 21.64, 89.94 ± 24.67, 104.79 ± 23.54, 118.20 ± 28.88, 140.25 ± 29.61 pA, respectively, n = 10 neurons/6 mice) with two-way ANOVA analysis followed by Bonferroni’s multiple comparisons test, and insets show representative traces of WT and FAD slices. G Input/output slope of each cell was calculated and analyzed with unpaired Student’s t-test, p = 0.066. H Representative traces (inset) and plot show PPRs at interstimulus intervals of 20, 50, 100, and 200 ms with unpaired Student’s t-test (WT, 2.18 ± 0.23, 1.74 ± 0.13, 1.52 ± 0.15, 1.21 ± 0.10, respectively, n = 17 neurons; FAD, 2.85 ± 0.42, 1.82 ± 0.14, 1.43 ± 0.13, 1.09 ± 0.08, respectively, n = 10 neurons, p = 0.14, 0.71, 0.68, 0.39 for each interstimulus interval). I Biocytin was added in pipette solution and injected intracellularly during whole-cell recording (left diagram), followed by staining with streptavidin-coupled Alexa 488. Right representative images show the sections of dendrites from WT and FAD neurons, bar scale 5 μm. J Biocytin-positive neurons were reconstructed with the Imaris software, and dendrite spine density and dendrite surface area were calculated and subjected to analysis, n = 3 mice for WT or FAD genotype. K Punched brain tissues containing CA1 area were subjected to electron microscopic observation. Red arrows show synapses, and the bar scale is 200 nm. L–O The number of synapses per 30 μm2 (L), synaptic cleft width (M), length (N), and width (O) of postsynaptic density (PSD) were calculated by the ImageJ software (20 synapses/3 mice in WT; 18 synapses/3 mice in FAD) and put into unpaired Student’s t-test. In B, C, and G, the dots show individual cells; in J, L–O, the dots show individual mice. All values are presented as mean ± SEM

