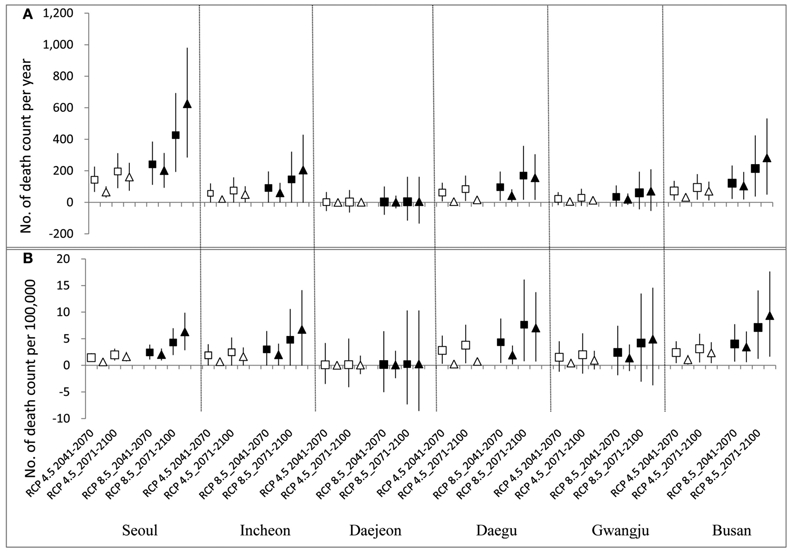
FIGURE 3 ∣. Heat-related mortality attributable to climate change under RCP 4.5 and RCP 8.5.

Top graph (A) presents absolute values of death count and bottom one (B) presents values of death count with adjustment of projected future population scale. (White square and triangle indicate results from “shitted” and “added” effect based on RCP 4.5 scenario and black square and triangle indicate results from “shitted” and “added” effect based on RCP 8.5, respectively; vertical bars indicate 95% confidence intervals).
