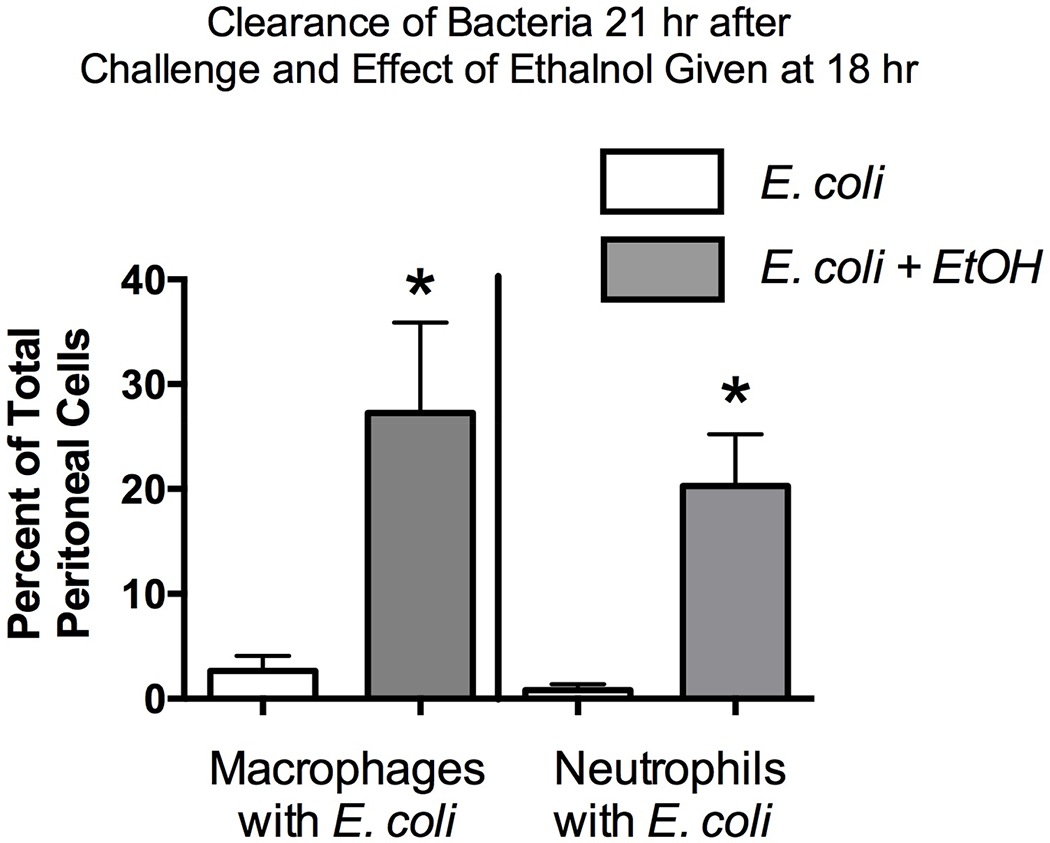
Figure 7.

Percentage difference in phagocytes with and without E. coli engulfed. Control mice receiving E. coli only and mice treated with E. coli then treated with alcohol (EtOH) 18 hr later are shown. Samples were collected 3 hr after the 18 hr alcohol treatment. Cytospin preparations were stained and enumerated. The group size was 5, and the results for E. coli compared to E. coli + Alcohol were compared by a t-test with Welch’s correction. Statistical significance is indicated by * (P < 0.05).
