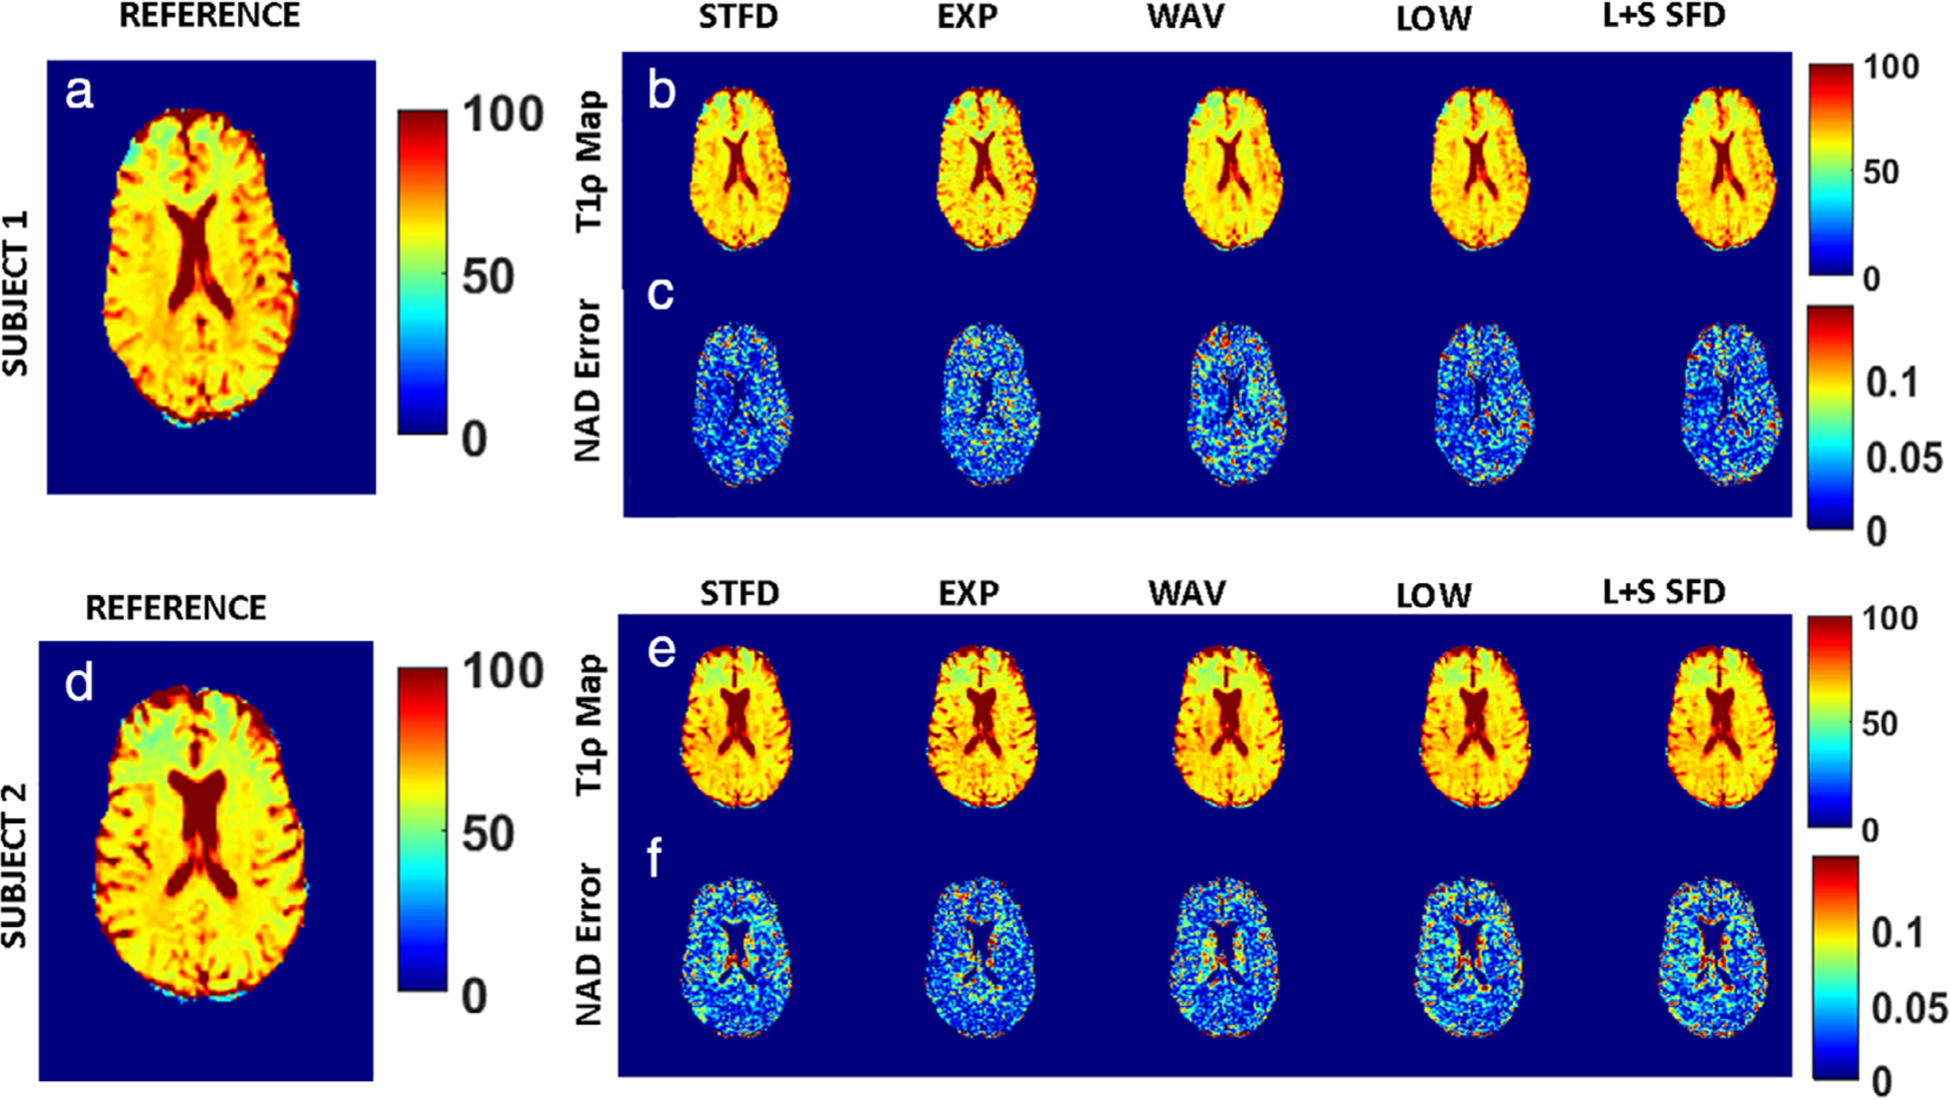
FIGURE 7:

T1ρ estimation performance comparison. For subject 1, (a) shows a representative slice of the estimated T1ρ map that is used as reference, (b) shows estimated T1ρ maps using the CS algorithms tested at AF = 5, and (c) shows the corresponding NAD error for each technique. Similarly, for subject 2, (d–f) show the reference T1ρ map, estimated T1ρ maps at AF = 5 for each CS method, and the corresponding NAD errors for each technique, respectively.
