FIGURE 8:

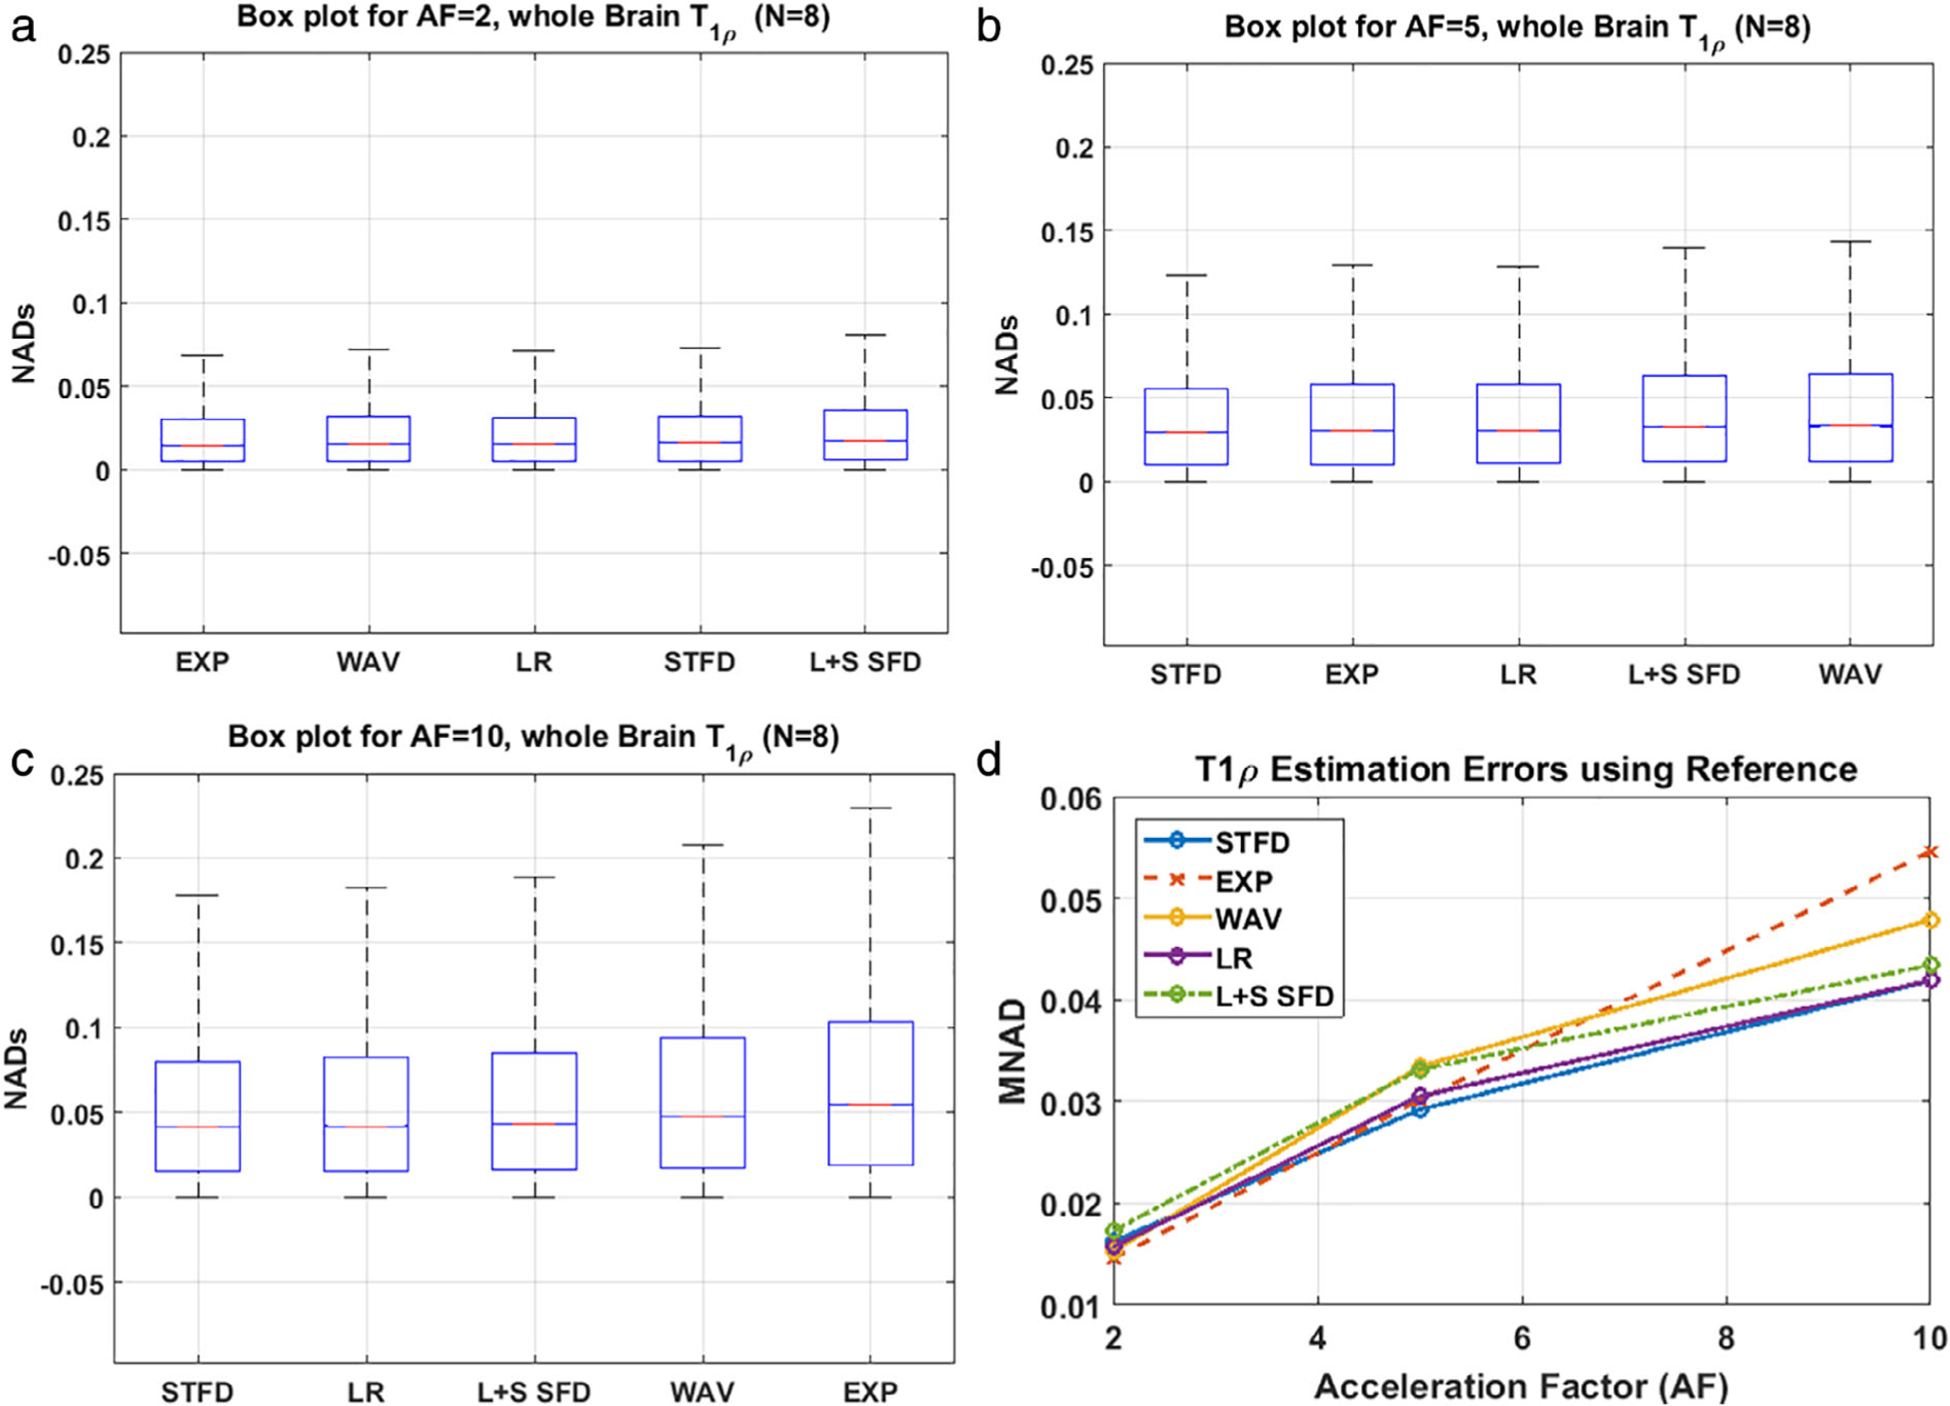
T1ρ estimation errors. Boxplots of NAD error are shown for (a) AF = 2, (b) AF = 5, (c) AF = 10. (d) The T1ρ estimation errors (MNAD) using the reference T1ρ maps. Results for STFD perform the best for the highest AF.

T1ρ estimation errors. Boxplots of NAD error are shown for (a) AF = 2, (b) AF = 5, (c) AF = 10. (d) The T1ρ estimation errors (MNAD) using the reference T1ρ maps. Results for STFD perform the best for the highest AF.