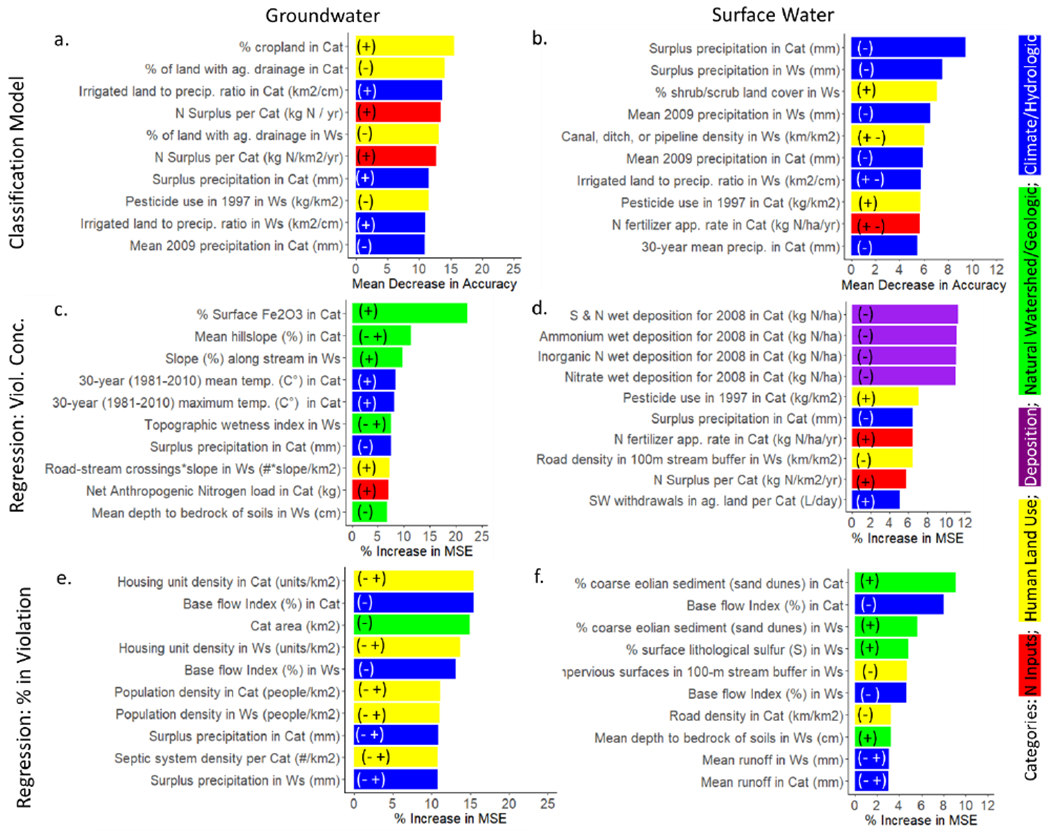
Figure 3.

Variable importance rankings for the top 10 variables based on the RF a) GW classification model, b) SW classification model, c) GW concentration model, d) SW concentration model, e) % GW systems in violation model, and f) % SW systems in violation model. The (+) or (−) symbols on the bars mean there was a positive or negative relationship between the predictor and response variables, respectively. And the (− +) symbol indicates there was first a negative then a positive relationship, while a (+ −) symbol indicates there was first a positive then a negative relationship. Cat = catchment; Ws = watershed.
