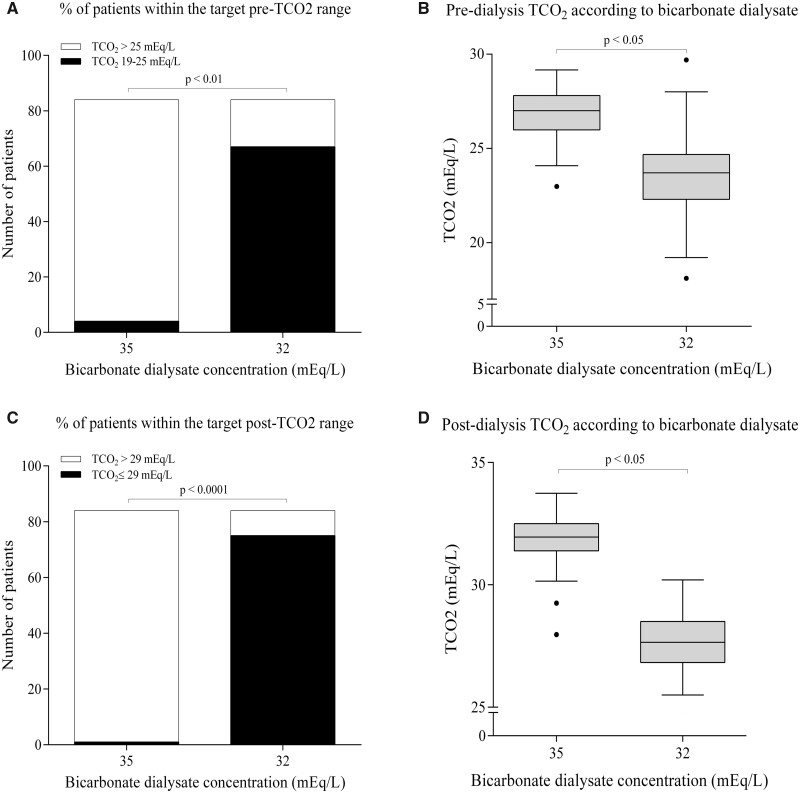
FIGURE 2.
Pre- and post-dialysis TCO2 according to dialysate bicarbonate. (A) Number of patients with a pre-dialysis TCO2 of 19–25 mEq/L and >25 mEq/L before and after dialysate bicarbonate concentration optimization. (B) Pre-dialysis TCO2 at baseline and at 6 months after dialysate bicarbonate optimization. (C) Number of patients with a post-dialysis TCO2 ≤29 mEq/L and >29 mEq/L before and after dialysate bicarbonate concentration optimization. (D) Post-dialysis TCO2 at baseline and at 6 months after dialysate bicarbonate optimization.

