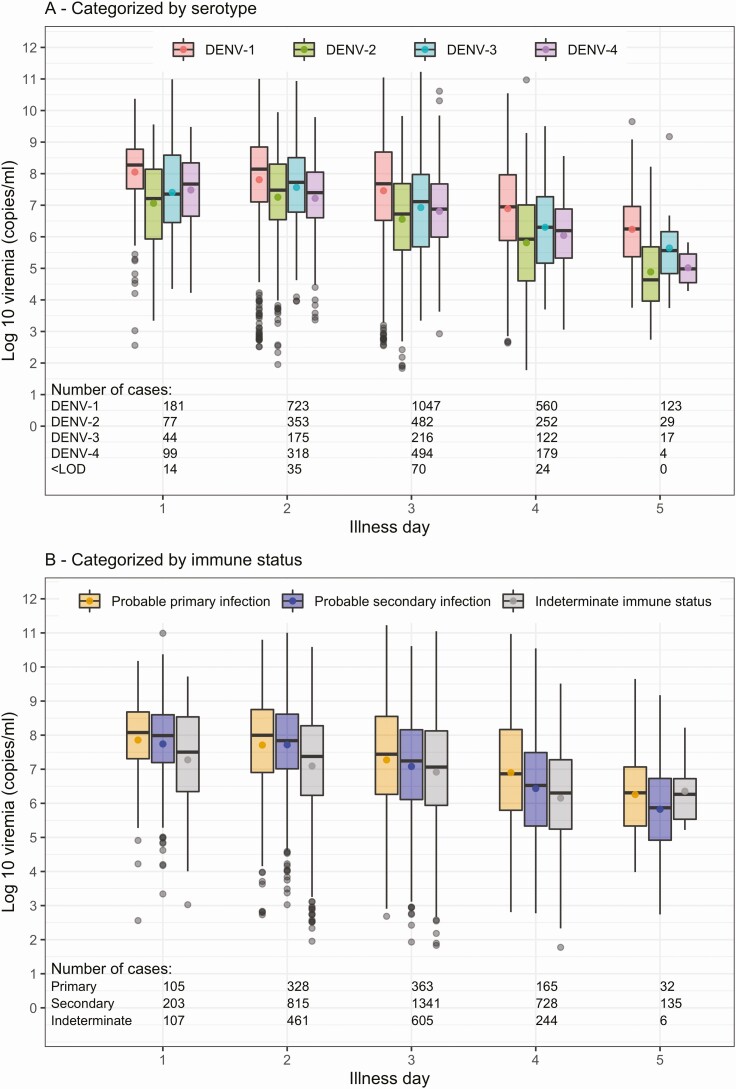
Figure 2.
Summary of enrollment plasma viremia levels by serotype and immune status for the complete-case analysis. In each plot, plasma viremia levels are presented by illness day and colored by serotype (A) or immune status (B). The line inside each box is the median, the upper and lower margins of each box represent the interquartile range (25th–75th percentile), and the circle in each box is the mean plasma viremia level. Abbreviations: DENV, dengue virus; <LOD, under the limit of detection (not shown for panel B as the numbers are the same as in panel A).

