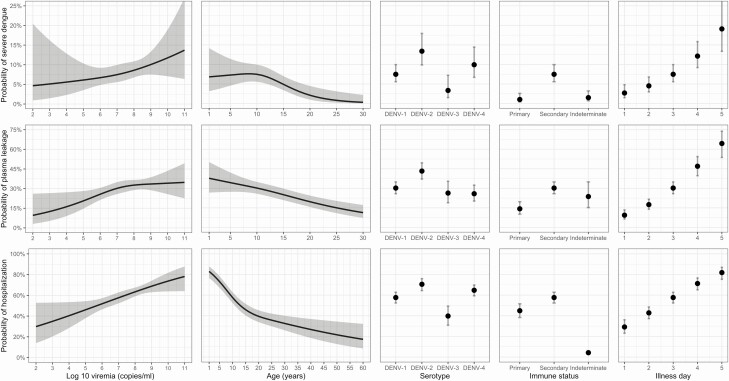
Figure 3.
Probability of occurrence of the 3 endpoints according to each variable included in the models. Results are based on models with nonmissing data only (complete-case analysis). The estimated probability for each clinical outcome is shown with a heavy black line or dot, and the 95% confidence intervals are shown as the gray-shaded regions or by the whiskers. The probabilities are estimated for log10 viremia = 7, age = 10, illness day = 3, serotype = DENV-1, and immune status = probable secondary infection. Note that the probability of hospitalization is very low for the indeterminate immune status group because of the study design—most cases in this group come from study C, in which a second blood sample was rarely obtained from the nonhospitalized cases. Abbreviation: DENV, dengue virus.

