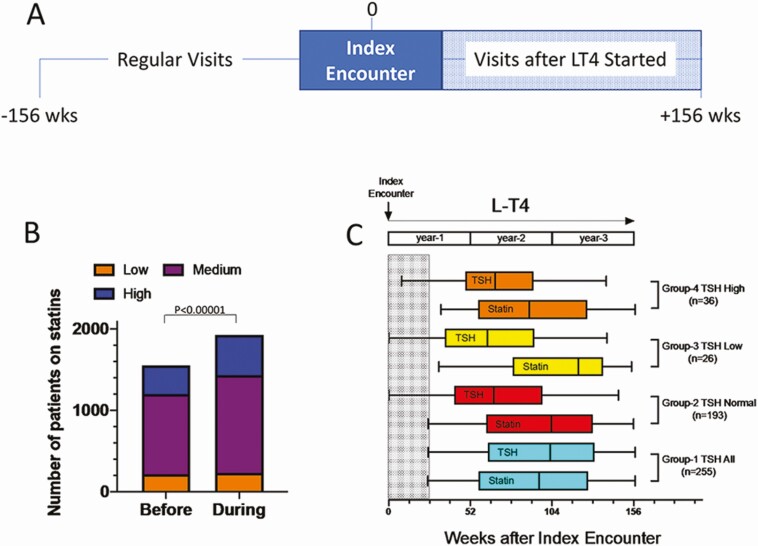
Figure 1.
(A) Timeline during which patient data were obtained at site 1; the analyses encompassed 3 years (156 weeks) prior the index encounter (start of therapy with LT4) and 3 years after LT4 was started; all patients had at least 2 clinic encounters with their providers before and 2 after therapy with LT4 was initiated. (B) Bar graph showing the total number of patients on statins before and after therapy with LT4 was initiated. Low, medium, and high indicate the intensity of treatment with statins. (C) Bar graph showing patients in each group in whom statin was initiated; the timing of stating initiation is shown along with the timing serum TSH was obtained, both measured in weeks after the index encounter; only patients in whom statins was initiated >6 months (shaded area) after index encounter were considered; 4 groups of patients are shown: Group-1, all patients that have a serum TSH on or around the time statin was initiated; Group-2, those patients with a normal serum TSH; Group-3, those patients with a suppressed serum TSH; and Group-4, those patients with a high serum TSH; the number of patients that were placed on statins after the index encounter is shown in parenthesis for each group; in all groups, statistical analysis was with McNemar’s test with a P < .01.

