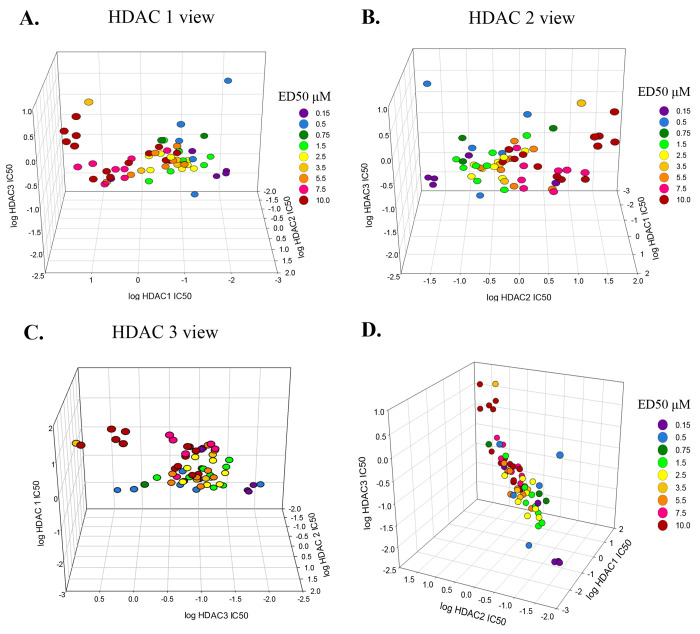
Figure 4.
Correlation between HDACi specificity (IC50) and dosage (ED50) for cholesterol clearance with compounds that inhibit HDACs 1, 2, and 3. (A) HDAC1 focused view. The (log) IC50 values for HDAC1 on the front facing axis show that points of similar ED50’s (color-coded) cluster in separate halves (reds to left, blue/purple to right). The ED50 values range from 0.15 μM (purple) to 10 μM (red). (B) HDAC2 focused view. The (log) IC50 values for HDAC2 on the front facing axis show a pattern that is a mirror image of the HDAC1 focused view. (C) HDAC3 focused view. The (log) IC50 values for HDAC3 on the front facing axis show an ED50 cluster pattern that is less distinct with red/pink clustered at the top while blue/purple is on the bottom. (D) Equal weighted plot for all three HDACs. The specificity of the inhibitor for HDACs 1, 2, and 3 is correlated with the experimentally determined ED50.

