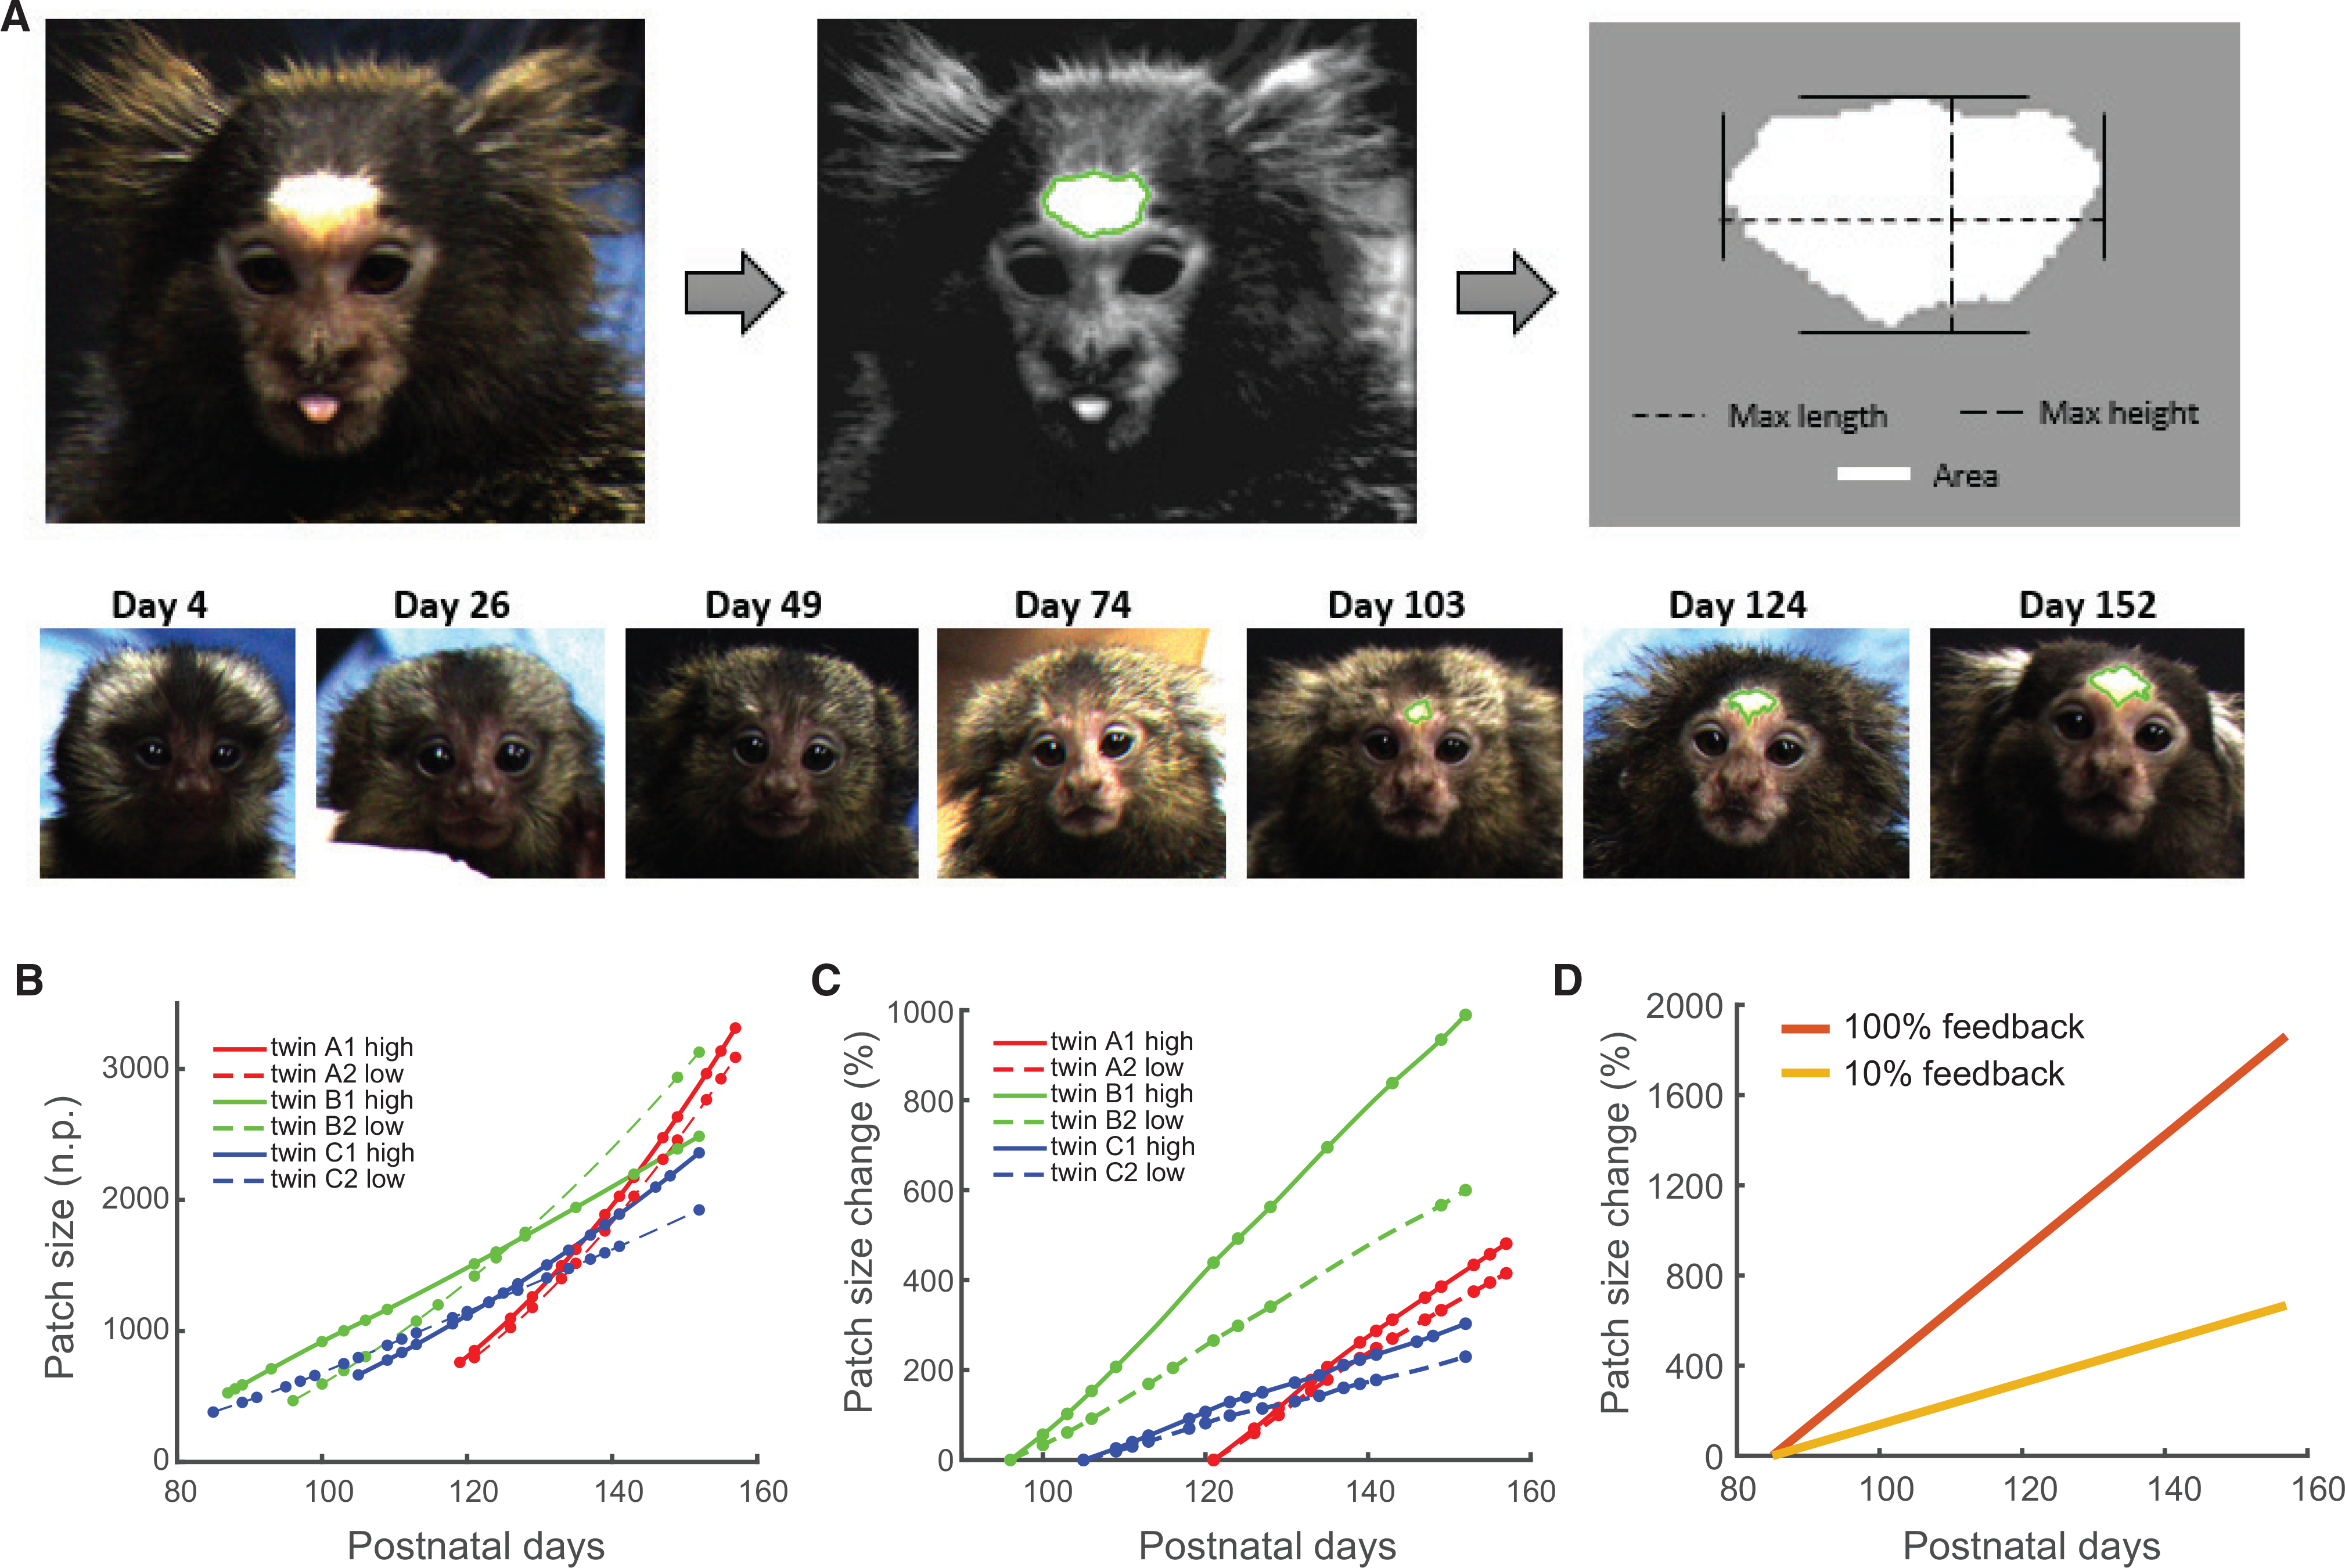
Figure 3. Contingent Vocal Feedback from Parents Influences the Rate of White Patch Development in Infants.

(A) White patch measurements were made semi-automatically using pulse-coupled neural networks. These captured the initial appearance and growth of the patch in infant marmosets.
(B) Graph representing the change in white patch size during development. Data are plotted from the first day of detection. White patch size is calculated in normalized pixel units (n.p.); circles show the dates when data were collected.
(C) Percentage change in white patch size as a function of contingency and after correcting for sex and body weight. The percentage is calculated comparing the sex and body-weight-correct white patch sizes with the size at days 121 (twin A), 96 (twin B), and 105 (twin C), respectively. Circles show the dates where data were collected.
(D) Predicted patch size change for each condition (100% and 10% feedback). The percentage change is estimated based on the white patch sizes estimated by the regression at postnatal day 85 for each group.
See Figure S2.
