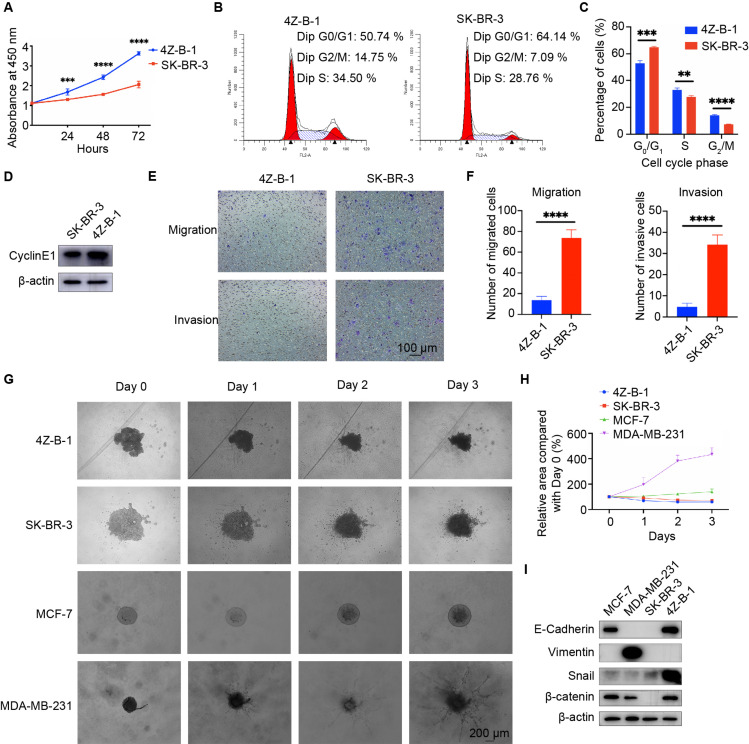
FIGURE 3.
Proliferative, migratory and invasive potential of the 4Z-B-1 cell line. (A) Growth curves of 4Z-B-1 and SK-BR-3 cells determined by the CCK8 assay. (B,C) Distribution of 4Z-B-1 and SK-BR-3 cells determined by flow cytometry and statistical analysis. (D) Expression of CyclinE1 in 4Z-B-1 and SK-BR-3 cells assessed by Western blotting. (E,F) Representative micrographs and statistical analysis of migrated and invasive 4Z-B-1 and SK-BR-3 cells. (G,H) Representative micrographs and statistical analysis of the invasive area of 4Z-B-1, SK-BR-3, MCF-7, and MDA-MB-231 mammospheres in Matrigel. (I) Expression of EMT markers in 4Z-B-1, SK-BR-3, MCF-7, and MDA-MB-231 cells determined by Western blotting. ****p < 0.0001. Magnification, (E) ×100; (G) ×40.

