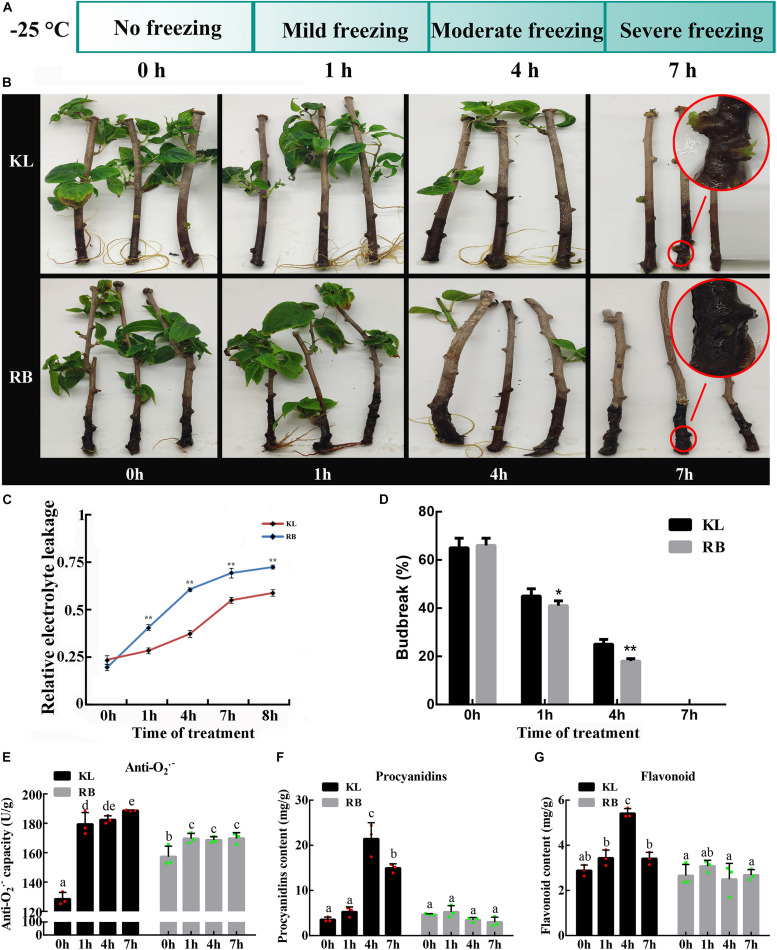
FIGURE 2.
Different REL (relative electrolyte leakage) and VB (vegetative bud) between the KL and RB genotypes under the −25°C treatment. (A) Metabolomic and transcriptomic analysis of both genotypes were performed at four time points: 0 h, 1 h, 4 h, 7 h. (B) Representative images of KL and RB at 0 h, 1 h, 4 h, 7 h. (C) The REL at different treatment time points under −25°C. VB rates after the −25°C treatment, given as the mean of three independent replicate experiments in both genotypes. (D) VB rates after the −25°C treatment, given as the mean of three independent replicate experiments in both genotypes. (E) The anti−O2.– capacity at different treatment. (F) The content of procyanidins at different treatment. (G) The content of flavonoid under −25°C.

