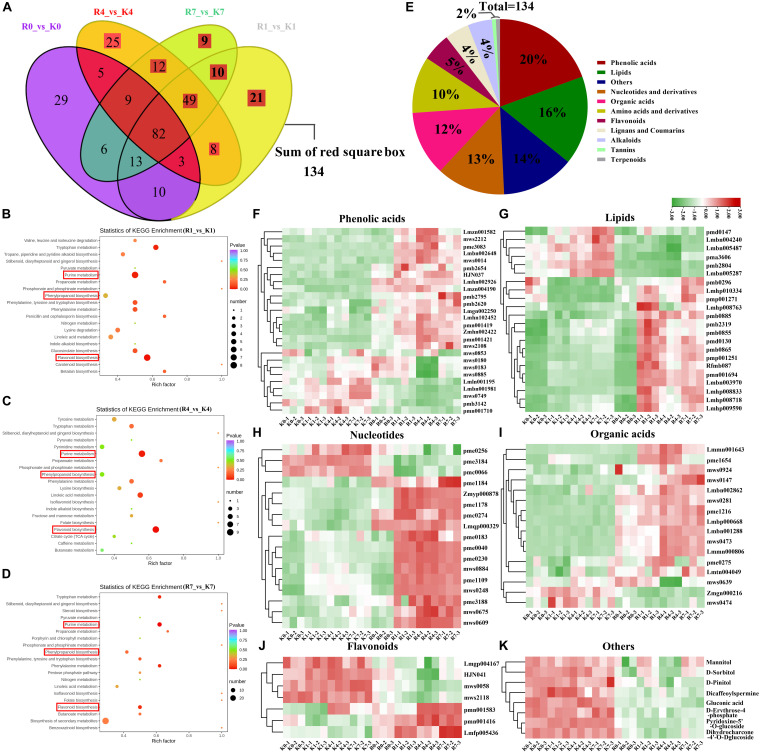
FIGURE 5.
Comparison of the DEMs between KL and RB under the freezing condition. (A) Venn diagrams of DEMs of KL and RB at different treatment time points. (B–D) KEGG pathway enrichment of DEMs at different treatment time points. (E) Classification of the 134 specific under cold stress. (F–K) Heat map of metabolite responsive to cold in both KL and RB.

