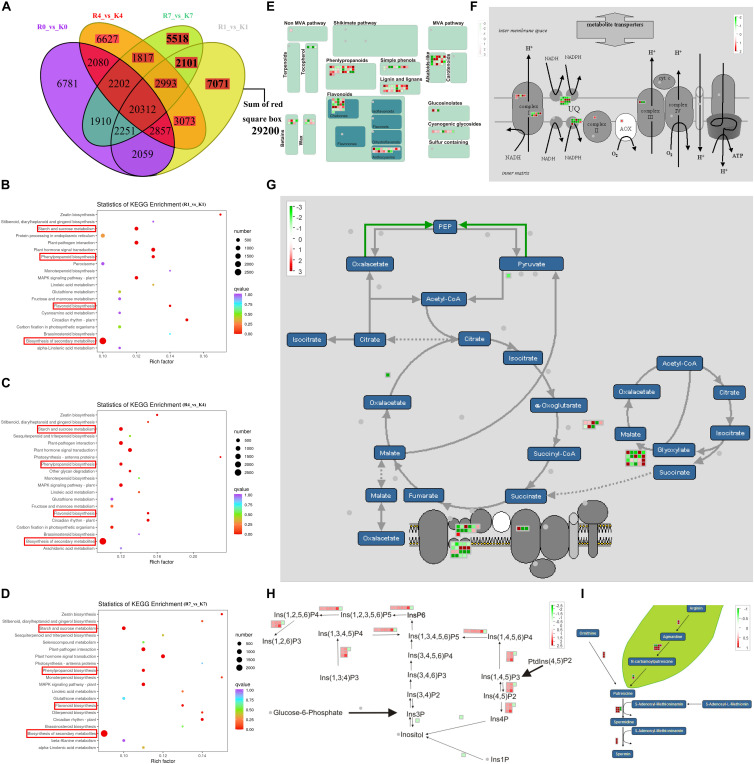
FIGURE 6.
Comparison of the DEGs between KL and RB under the freezing condition. (A) Venn diagrams of DEGs of KL and RB at different treatment time points. (B–D) KEGG pathway enrichment of DEGs at different treatment time points. (E–I) The secondary metabolism, mitochondrial-electron-transport, TCA, inositol phosphates, spermine synthesis pathways, all analyzed via Mapman in DEGs. These values are the medians from log2(fpkm-KL/fpkm-RB) values of the 1 h, 4 h, and 7 h for each DEG. Red and green denote the up-regulation and down-regulation, respectively.

