
Figure EV1. Transcriptome analysis of dermal endothelial cells.
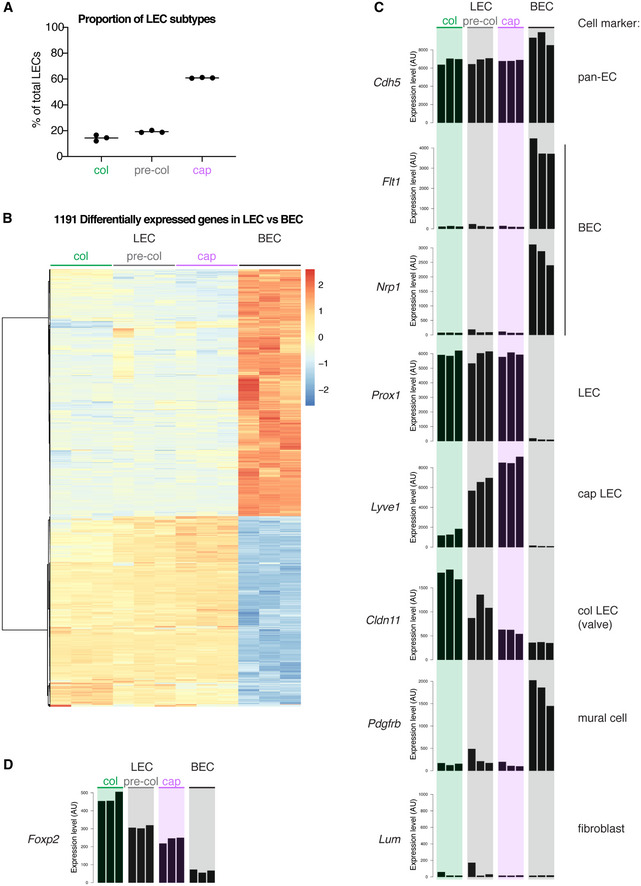
- Proportion of LEC subpopulations (of the total LEC population) sorted from mouse ear skin based on expression of LYVE1, PDPN, and Prox1‐GFP as shown in Fig 1A (n = 3 samples). Horizontal line indicates mean. Col, collecting vessel; pre‐col, pre‐collecting vessel; cap, lymphatic capillary.
- Heat map showing differential expression of 1,191 genes between dermal LEC and BEC. Color coding shows log2 fold change. Gene ID list is provided in Dataset EV1.
- Intensity bar plots of cell lineage/phenotype genes showing expression in dermal EC populations (each bar represents one sample, n = 3). Y‐axis represents expression level (signal intensity value given in arbitrary units (AU)).
- Intensity bar plot of Foxp2 showing expression in dermal EC populations (n = 3). Y‐axis represents expression level (signal intensity value given in arbitrary units (AU)).