
Figure 1. Knockdown of Phf5a inhibits CSR.
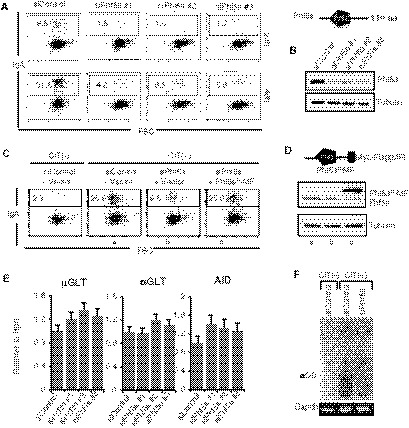
- Representative FACS profiles of IgA switching in CH12F3‐2A cells. The control and Phf5a siRNAs are indicated at the top. The number in each FACS profile indicates the percent (%) IgA+ cells at 24 and 48 h after CIT stimulation.
- Top: Illustration of Phf5a with a central PHD domain. Bottom: Confirmation of Phf5a KD by Western blot.
- CSR complementation assay using siRNA‐resistant Phf5a with Myc and Flag (MF) epitopes tagged at the C‐terminus.
- Schematic of MF‐tagged siRNA‐resistant Phf5a (Phf5aR‐MF). Asterisks (*) indicate the approximate locations of mutations in the cDNA made to generate the siRNA‐resistant version. Western blot confirmed the KD efficiency of the endogenous Phf5a, and the expression of Phf5aR‐MF.
- Quantitative RT–PCR (qRT–PCR) of µGLT, αGLT, and AID from siControl‐ and siPhf5a‐treated samples. The values are presented as mean ± SD (n = 3).
- Ethidium Bromide‐stained gels showing the PCR detection of excision circular DNA (αCD) and Gapdh as a control in the genomic DNA samples indicated.