
Figure 5. Impaired recruitment of NHEJ factors to the IgH locus upon Phf5a deficiency.
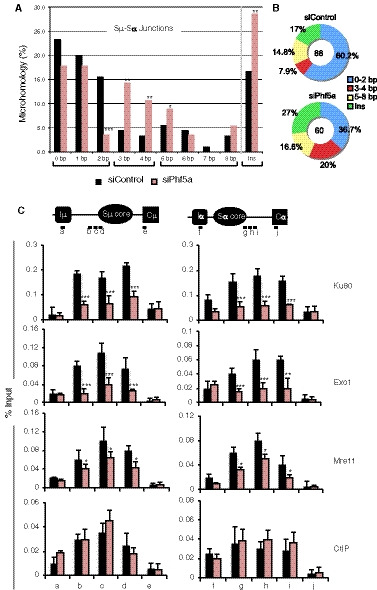
- Analysis of Sµ‐Sα recombination junctions in the genomic DNA isolated from siControl‐ and siPhf5a‐transfected CH12F3‐2A cells stimulated by CIT for 48 h. The values are presented as mean ± SD (n = 3). Statistical significance was evaluated in reference to siControl by two‐tailed unpaired Student’s t‐test (*P ≤ 0.05, **P ≤ 0.01, and ***P ≤ 0.001).
- The proportion of insertions versus microhomology regions of various lengths in the Sµ‐Sα junctions presented as a pie chart. The number of clones analyzed from control and Phf5a‐depleted samples is indicated at the center.
- Top: Schematic diagram of the position of the ChIP assay PCR products specific to the S region. Bottom: ChIP assay of the indicated DNA repair proteins using CIT‐stimulated CH12F3‐2A cells transfected with siControl or siPhf5a. The values are presented as mean ± SD (n = 3). Statistical significance was evaluated in reference to siControl by two‐tailed unpaired Student’s t‐test (*P ≤ 0.05, **P ≤ 0.01, and ***P ≤ 0.001).