
Figure 7. The Phf5a mutants with a loss of CSR function show defects in protein–protein interactions.
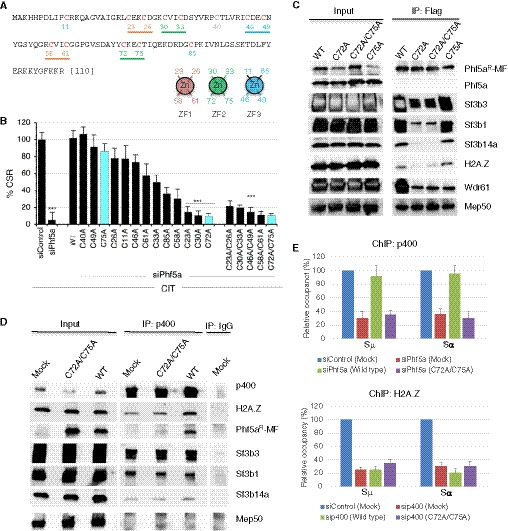
- Amino acid sequence of mouse Phf5a protein. The 12 Cys residues indicated in red are part of the PHD finger‐like domain. Each CxxC motif is underlined and color coded according to their pairing with another CxxC motif to form a zinc finger (ZF). A pair of CxxC motifs holds the zinc atom in each ZF. Arrangement of 4 Cys residues in ZF1‐3 is schematically shown below the Phf5a sequence.
- CH12F3‐2A cells were transfected with siRNAs along with empty vectors or vectors expressing various zinc‐finger mutants of Phf5a (Phf5aR‐MF). Twenty‐four hours after transfection, the cells were stimulated by CIT for another 24 h and then examined for CSR. The efficiency of IgA switching was calculated relative to the value obtained for siControl and empty vector‐transfected cells. The data are compiled from three independent experiments. The values are presented as mean ± SD (n = 3). Statistical significance was performed in reference to siControl by two‐tailed unpaired Student’s t‐test (***P ≤ 0.001). See Appendix Fig S8 for a representative data set.
- CH12F3‐2A cells were transfected with WT Phf5a or its mutants (Phf5aR‐MF) along with siRNA against Phf5a. An anti‐Flag antibody was used to immunoprecipitate and immunodetect Phf5aR‐MF. An anti‐Phf5a immunoblot confirmed the knockdown efficiency of the endogenous Phf5a. The antibodies used to detect the co‐associated proteins are indicated next to the respective blot.
- CH12F3‐2A cells transfected with WT or a mutant Phf5a (Phf5aR‐MF) were subjected to anti‐p400 immunoprecipitation. Associations with relevant interacting proteins were examined by immunoblot analysis and are indicated next to each blot.
- ChIP assay derived from CH12F3‐2A cells transfected with the indicated siRNA and Phf5a (Phf5aR‐MF) expression constructs. Antibodies used for ChIP are indicated on the top of the respective plot. The data are summarized from 2 independent experiments and presented relative to siControl‐treated sample, which was set as 100. The error bars represent the mean ± SD.