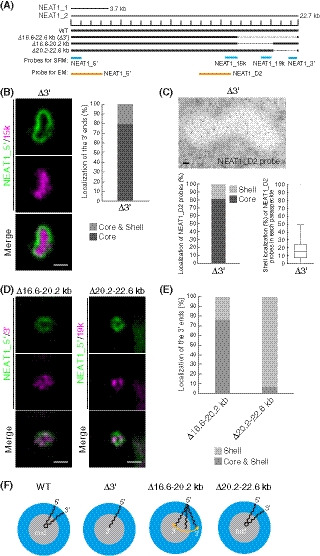
Figure 1. Deletion of the 3′ terminal domain of NEAT1_2 causes core localization of the 3′ ends of NEAT1_2 within the paraspeckle.

- The schematics of human NEAT1_2 (WT) and the mutants with deletions in the 3′ terminal regions. The NEAT1 transcripts are shown above with a scale. The gray dashed lines represent the deleted regions. The positions of NEAT1 probes used in SRM (blue) and EM (orange) are shown.
- (left) SRM images of paraspeckles in HAP1 NEAT1 Δ3′ mutant cells (Δ3′) detected by NEAT1_5′ (green) and NEAT1_15k (magenta) FISH probes in the presence of MG132 (5 μM for 6 h). Scale bar, 500 nm. (right) Graph showing the proportion of paraspeckles with localization of the NEAT1 3′ ends in the core or in the core and shell (n = 44).
- (upper) EM observation of the paraspeckles in Δ3′ cells using NEAT1_D2 probes in the presence of MG132 (5 μM for 17 h). Scale bar, 100 nm. (lower, left) Graph showing the proportion of localization of the NEAT1 region detected by NEAT1_D2 probe (248 gold particles) within the paraspeckles in Δ3′ cells. (lower, right) Graph showing the proportion of localization of NEAT1_D2 probes in each paraspeckle in Δ3′ cells (n = 17). The box plot shows the median (inside line), 25–75 percentiles (box bottom to top), and 10–90 percentiles (whisker bottom to top).
- SRM images of the paraspeckles in Δ16.6–20.2 and Δ20.2–22.6 kb cells detected by NEAT1_5′ (green) and NEAT1_3′ or 19k (magenta) FISH probes in the presence of MG132 (5 μM for 6 h). Scale bar, 500 nm.
- Graph showing the proportion of paraspeckles with localization of the NEAT1 3′ ends to the core and shell or the core in Δ16.6–20.2 and Δ20.2–22.6 kb cells treated with MG132 (5 μM for 6 h). (Δ16.6–20.2 kb: n = 230, Δ20.2–22.6 kb: n = 99)
- Schematics of the NEAT1_2 configuration in WT and deletion mutants.
Source data are available online for this figure.
