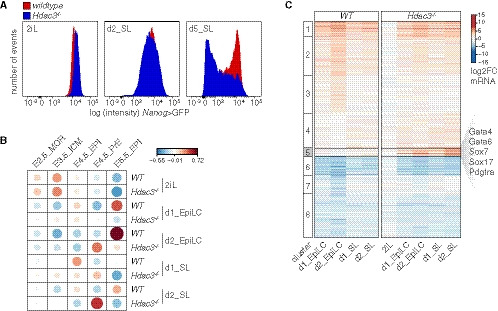
Figure 1. Naïve Hdac3 −/− mESCs differentiate into PrE.

- Nanog>GFP intensity of WT and Hdac3 −/− TNG‐A cells in 2iL and at d2 and d5 of SL exposure.
- Pairwise Pearson correlations of in vitro TNG‐A and in vivo embryo (Boroviak et al, 2015) RNAseq samples.
- k‐means clustering of gene expression changes relative to naïve WT TNG‐A mESCs.
Source data are available online for this figure.
