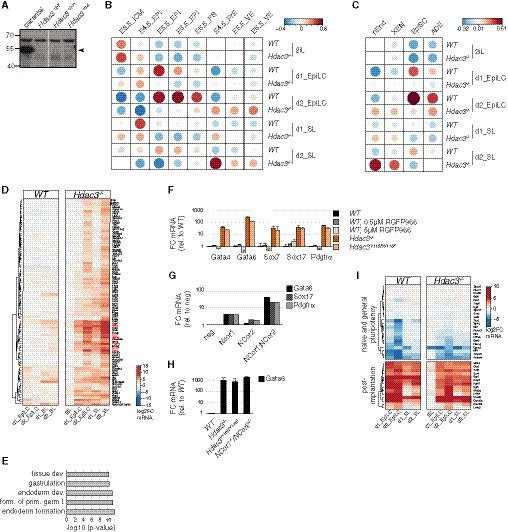
Figure EV1. Transcriptomics of Hdac3 −/− cells.

-
AAnti‐Hdac3 Western blot of naïve Hdac3 −/− TNG‐A clones. Specific Hdac3 band is indicated.
- B, C
-
DSimilar to Fig 1C with a magnified view of cluster 5. Canonical PrE marker genes are highlighted in red.
-
EGO terms enriched in cluster 5. Modified Fisher exact P‐values as determined by DAVID (Huang et al, 2008) are shown.
-
F–HIndicated mRNA levels relative to WT cells of indicated genotypes and treatments after 3 days in SLRA (F) and 2 days in SL (H). Average and standard deviation (SD) of at least two independent clones. Indicated PrE marker mRNA expression relative to negative control siRNA transfection of cells transfected with indicated siRNAs after 2 days in SL (G).
-
ISimilar to Fig 1C with a magnified view of a panel of naïve and general pluripotency, and post‐implantation markers.
Source data are available online for this figure.
