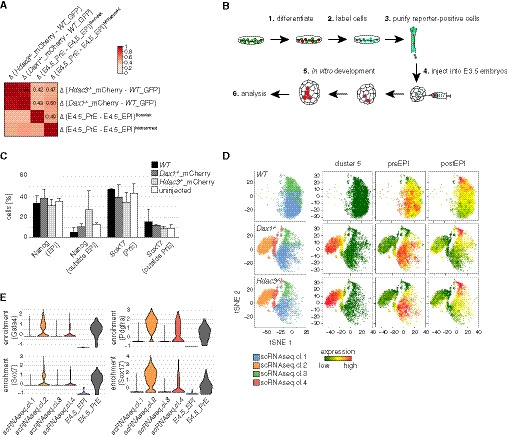
Figure EV3. Characterization of mESC‐generated PrE cells.

- Pairwise Pearson correlation of transcriptional differences between indicated samples. Individual correlation coefficients are indicated.
- Experimental scheme used to determine developmental competence of subpopulations.
- Quantification of the cell fate (based on expression of Nanog and Sox17) and the localization of unlabeled endogenous cells. Average and SD of two independent experiments with at least 5 embryos per condition and experiment.
- Similar to Fig 3E. Only cells of indicated genotypes are shown.
- Similar to Fig 3F, showing expression distribution of indicated transcripts.
Source data are available online for this figure.
