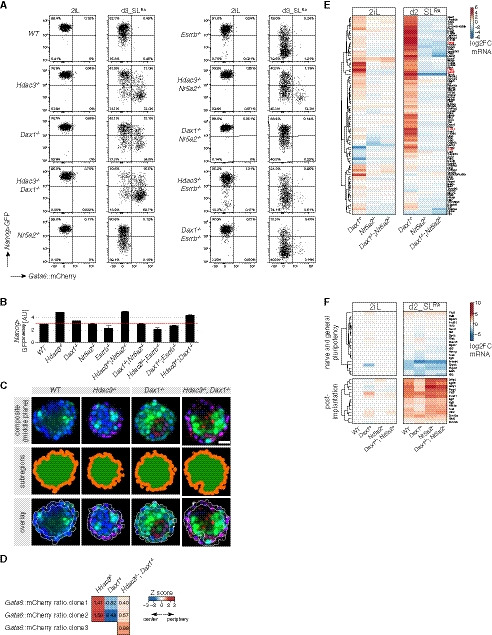
Figure EV4. Characterization of compound mutant cells.

- Representative Nanog>GFP and Gata6::mCherry intensity plots of genotypes and conditions quantified in Fig 4C.
- Geometric mean intensity of Nanog>GFP reporter in 2iL. Average and SD of three independent clones.
- Similar to Fig 2F. Scale bar: 25 μm.
- Similar to Fig 2G.
- Similar to Fig 4D, but focusing on cluster 5 genes.
- Similar to Fig EV1I with a magnified view of a panel of naïve and general pluripotency, and post‐implantation markers in indicated genotypes and conditions relative to naïve WT cells in 2iL.
Source data are available online for this figure.
