
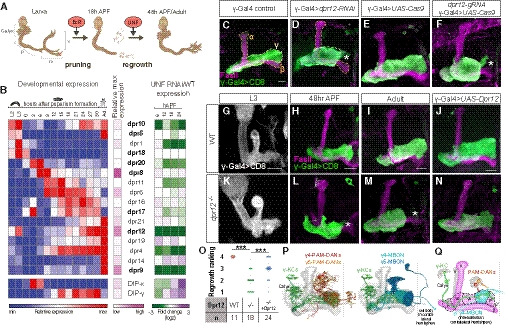
Figure 1. Dpr12 is required for full extension of γ‐KCs.
-
ASchematic representation of neuronal remodeling of γ‐KCs and its regulation by the nuclear receptors EcR and UNF. p: axon peduncle; m/v: medial and vertical lobes.
-
BDynamic expression of Dprs and DIPs during γ‐KC development. Left: Heatmap depicting the relative expression patterns of Dprs and DIPs in γ‐KCs during development. Middle: Magenta intensity depicts the peak expression of each gene during development relative to other Dprs and DIPs. Right: Expression change of Dprs and DIPs while knocking down the UNF transcription factor compared to WT γ‐KCs. Dprs highlighted in bold were tested in the RNAi mini‐screen (Fig EV1).
-
C–NConfocal z‐projections of the indicated genotypes and age, labeled with membrane‐bound GFP (mCD8‐GFP; CD8) driven by the γ‐specific Gal4 driver GMR71G10‐Gal4 (γ‐Gal4). While γ‐axons of control flies project through the entire lobe (C is the RNAi control; n = 12/12, E is the tsCRISPR control; n = 14/14), knockdown of dpr12 by RNAi (D; n = 12/12) or knockout by tsCRISPR (F; n = 14/14) resulted in short axons. At L3, γ‐axons in dpr12∆50‐81 homozygous mutant animals (K; n = 20/20) resemble WT γ‐axons (G; n = 20/20). At 48 h APF, WT γ‐axons normally re‐extend to form the adult lobe (H; n = 12/12). dpr12∆50‐81 γ‐axons (L; n = 14/14) fail to extend to the end of the lobe. This defect persists to adult (I; n = 11/11 vs. M; n = 18/18). Expressing a UAS‐Dpr12 transgene within γ‐KCs in dpr12∆50‐81 homozygote mutant animals rescued the axon regrowth defect (N; n = 23/24, J; n = 14/14). The adult γ‐lobe and α/β lobes are outlined in (C, D) in yellow and orange, respectively, for clarity. Asterisks demarcate the distal part of the lobe. Green and white indicate mCD8‐GFP. Magenta represents FasII staining. Scale bar is 20 µm.
-
OQuantification of the regrowth defects in (I, M, and N). The z‐projections were blindly classified into four classes of regrowth defect severity; see Fig EV1D for examples. Significance was calculated by Kruskal–Wallis test followed by a Mann–Whitney post hoc test; ***P < 0.001.
-
PModels based on hemibrain EM traces (Scheffer et al, 2020) of adult γ‐KCs (representative neurons shown in green), in relation to either selected PAM‐DANs (left; red and orange) or MBONs (right; cyan and blue) targeting the γ4 and γ5 zones. Note that the cell body of the γ4‐MBON is located in the contralateral hemisphere. The MB neuropil is shown in gray. See Materials and Methods for additional details.
-
QSchematic representation of the adult MB. The bundled γ‐KCs form the γ‐lobe (an example of a single γ‐KC is depicted in green). The γ1‐γ5 zones are defined by stereotyped and tiled innervations of the γ‐lobe by dopaminergic neurons (DANs; examples of DANs targeting the γ4 and γ5 zones are depicted in red and orange, respectively) and MB output neurons (MBONs; an example of the γ4 > γ1γ2 MBON innervation is shown in cyan to match the schematics in Fig 7E and F; note that its cell body and innervations are located in contralateral hemispheres). Black dashed line represents the midline. Magenta represents typical FasII staining (which stains the α/β lobes and the γ‐lobe but not the α’/β’ lobes).