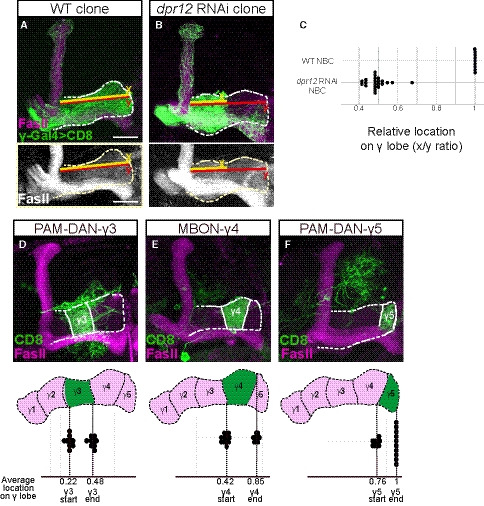
Figure EV2. Measurements of γ‐axon outgrowth, related to Fig 2.

-
A, BConfocal z‐projections of WT (A) and dpr12 RNAi (B) MARCM neuroblast clones (NBC) labeled with membrane‐bound GFP (mCD8‐GFP; CD8) driven by the γ‐specific Gal4 driver GMR71G10‐Gal4 (γ‐Gal4). y (red) represents the length of the entire γ‐lobe as indicated; x (yellow) represents the extent of clonal γ‐axon outgrowth.
-
CMeasurements of the x/y ration as depicted in (A, B). While WT NBC always extends up to the end of the lobe, dpr12 RNAi NBC stops at about midway (x/y ratio of 0.48 ± 0.05).
-
D–FTop: Confocal z‐projections of PAM‐DAN‐γ3 (D, MB441B), MBON‐γ4 > γ1γ2 (E, R18H09), and PAM‐DAN‐γ5 (F, R48H11) Gal4s driving the expression of mCD8‐GFP (CD8). Bottom: start and end of the indicated zone is superimposed on a schematic representation of the adult γ lobe compartments. (D) γ3 zone begins at x/y ratio of 0.22 ± 0.03 and ends at 0.48 ± 0.03. (E) γ4 zone begins at x/y ratio of 0.42 ± 0.04 and ends at 0.85 ± 0.03. (F) γ5 zone begins at x/y ratio of 0.76 ± 0.03 and ends at a mean ratio of 1. Green is CD8‐GFP; magenta and white represent FasII. Scale bar is 20 µm.
