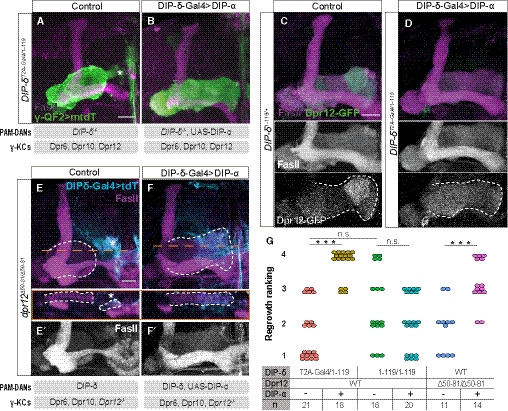
Figure 8. γ4/5 zone formation depends on matching Dpr‐DIP‐pairing between γ‐KCs and PAM‐DANs.

-
A, BConfocal z‐projections of adult DIP‐δT2A‐Gal4/ 1‐119 trans‐heterozygous mutant brains, in which γ‐KCs are labeled by membrane‐bound tandem tomato (mtdT‐HA; green) driven by R71G10‐QF2 (γ‐QF2), and DIP‐δ‐Gal4 (expressed in DIP‐δ+ neurons) either drives expression of UAS‐DIP‐α (B) or not (A). Gray boxes below the images describe the relevant components within PAM‐DANs and γ‐KCs.
-
C, DConfocal z‐projections of adult DIP‐δT2A‐Gal4/ 1‐119 trans‐heterozygous mutant (D) or DIP‐δ1‐119/ + heterozygous (C) brains, which express MiMIC mediated Dpr12GFSTF (Dpr12‐GFP; green). In (D), DIP‐δ‐Gal4 drives expression of UAS‐DIP‐α. Grayscale panels represent single channels, as indicated. The γ‐lobe is outlined in white.
-
E, FConfocal z‐projections of adult dpr12Δ50‐81 homozygous mutant brains, in which DIP‐δ‐Gal4 drives expression of either UAS‐mtdT (E) or UAS‐DIP‐α‐T2A‐tdT (F; expected to induce expression of DIP‐α as well as tdT encoded by a polycistronic message). In orange are longitudinal sections across the γ‐lobe at the indicated location. The γ‐lobe is outlined in white, as determined by FasII staining (gray in E’‐F’). Cyan is tdT within DIP‐δ+ cells. Gray boxes below the images describe the relevant components within PAM‐DANs and γ‐KCs.
-
GRanking of regrowth for (A, B, E, F) and Fig EV6A and B. Regrowth defect severity and statistics were calculated as in Fig 1; Wilcoxon–Mann–Whitney test; ***P < 0.001; ns, not significant.
Data information: In all images, magenta is FasII. Asterisks demarcate the distal part of the lobe. Scale bar is 20 µm.
