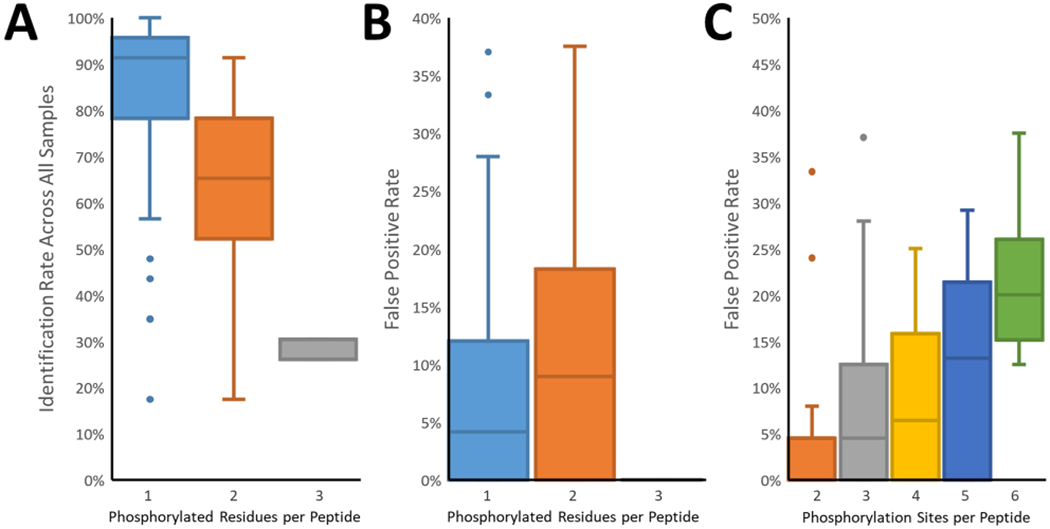
Figure 5.

Analysis of the correct phosphorylation site identification. (A) The frequency of correct identification across all reports decreased as the number of phosphorylated residues per peptide increased. Here the identification required both sequence and localization to be correct. (B) The false localization rate was higher among multiply phosphorylated peptides. The exception was the triply phosphorylated peptides, where only a single alternate site existed on only one of the three peptides. (C) False localization rates increased in parallel with the number of potential sites (serine, threonine, tyrosine) per peptide.
