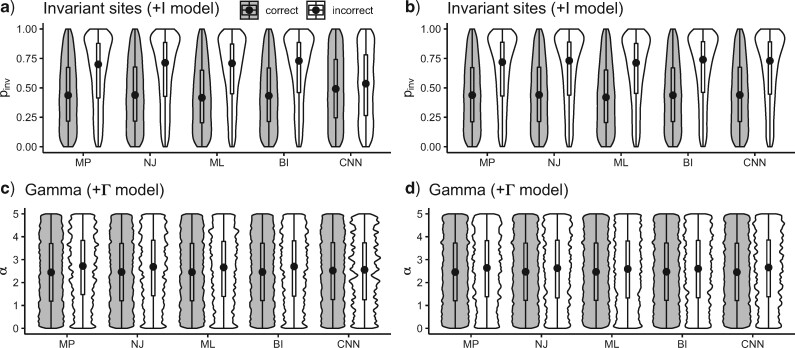
Figure 3.
Differences in parameter values between correct and incorrect classifications for each method. The distribution of the parameter governing the fraction of invariable sites ( for correctly and incorrectly inferred trees for a) gapped and b) ungapped MSAs. The distribution of gamma rate parameter (
 for correctly and incorrectly inferred trees for c) gapped and d) ungapped MSAs. The black dots of each violin plot indicate median of the distribution. These results were obtained using 15,000 simulated MSAs from BL-space. BI = Bayesian inference; CNN = convolutional neuronal network; ML = maximum likelihood; MP = maximum parsimony; NJ = neighbor-joining.

