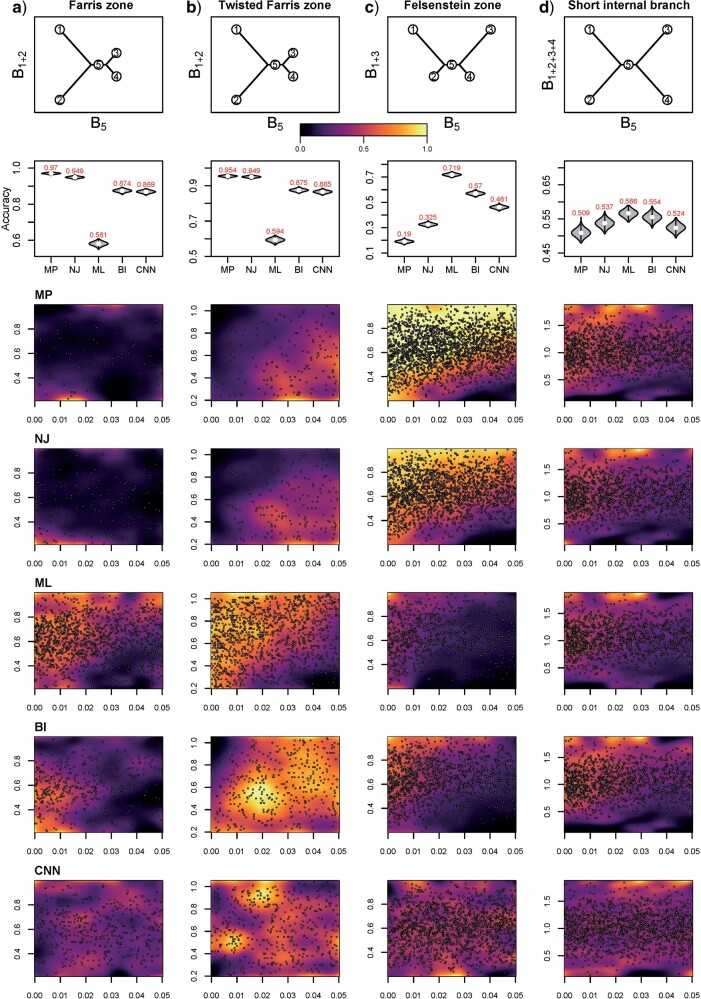
Figure 5.
Accuracy within regions with elevated branch-length heterogeneity for ungapped MSAs. The four columns summarize results in a) the Farris zone, b) the twisted Farris zone, c) the Felsenstein zone, and d) trees with short internal branches. The top row illustrates these tree branch-length configurations, and the second row shows accuracy of each method’s performance in each zone (with violins representing accuracy on bootstrap replicates from the test set). Panels three through seven show the locations (gray dots) and densities (heat map) of incorrectly inferred topologies for each method plotted in two-dimensional space with B length on the x-axis and B
 +B
+B (labeled as “B
 ”), B
”), B +B
+B (“B
(“B ”), B
”), B +B
+B (“B
(“B ”), B
”), B +B
+B +B
+B +B
+B (“B
(“B ”) on the y-axis for Farris, twisted Farris, Felsenstein, and short internal branch regions, respectively. See Table 1 for branch-length simulation details. The color scale shows the estimated density of the incorrectly inferred topologies at each point in the branch-length parameter space, with brighter colors representing a greater density of errors. BI = Bayesian inference; CNN = convolutional neuronal network; ML = maximum likelihood; MP = maximum parsimony; NJ = neighbor-joining.

