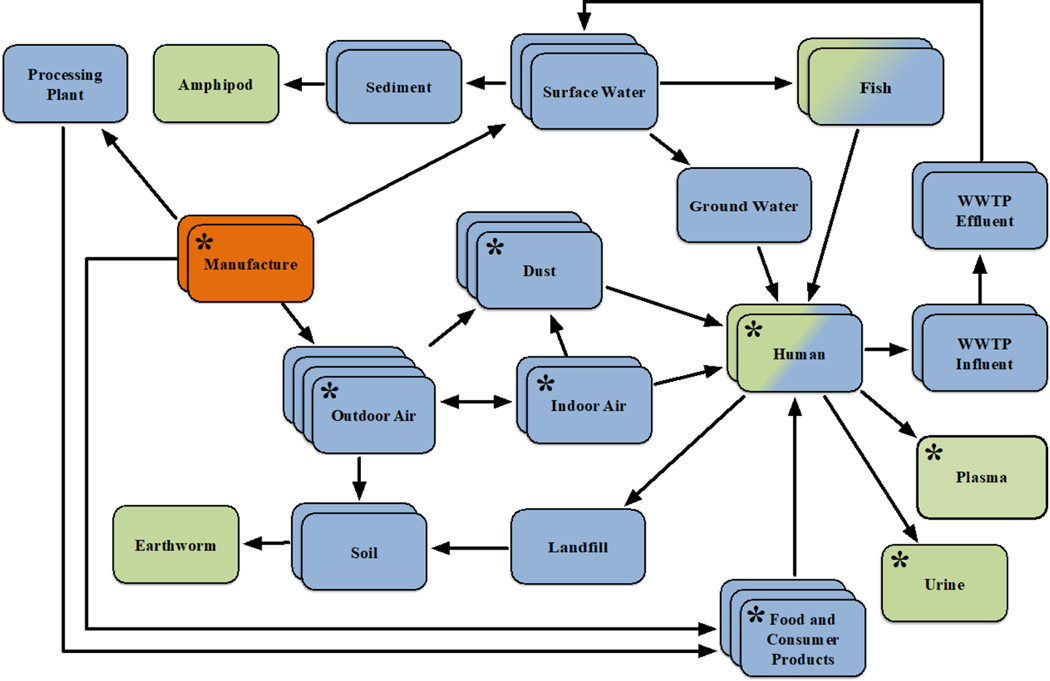
Figure 2.
A visual Aggregate Exposure Pathway for phthalates, as determined from information extracted from literature. Key exposure states (KESs) are represented as stacks of boxes, with each stack meant to describe temporal and spatial information (i.e., date and location recorded for the samples, as extracted from different literature resources) for that particular KES. Key transitional relationships (KTRs) are represented as arrows, and for the purpose of this figure, are only transport processes from one KES to another for a parent phthalate. The source is represented by orange stacks, while the target site exposure (TSE) is represented by green stacks. A blue-green box is meant to demonstrate that a TSE from one species can act as an intermediate KES for another species, such as consumption of contaminated fish tissue. Note that most TSEs unrelated to humans are inferred from laboratory studies artificially exposing the given species to the medium in question, under the assumption that that particular species is susceptible to exposure due to knowledge of its and the chemicals’ presence in that medium. While multiple empirically-derived KESs are represented in this figure, for the purposes of our case study, only eight are of focus here (i.e., those boxes that include asterisks) due to their relative importance in regards to what was found during the literature review.

